MAIN PUBLICATION :
| Home � Executive Summary � Part III: Economics |

|
PART III: THE ECONOMICS OF WIND POWER
Wind power is developing rapidly at both European and global levels. Over the past 15 years, the global installed capacity of wind power has increased from around 2.5 GW in 1992 to more than 94 GW at the end of 2007 – an average annual growth of more than 25 per cent. Due to ongoing improvements in turbine efficiency and higher fuel prices, wind power is increasing in economic competitiveness against conventional power production. At sites with high wind speeds on land, wind power is today considered to be fully commercial.
Source: Vestas
ONSHORE WIND POWER
Capital costs of onshore wind energy projects, covered in Chapter III.1, are dominated by the cost of the wind turbine. The total investment cost of an average turbine installed in Europe is around €1.23 million/MW, including all additional costs for foundations, electrical installation and consultancy (2006 prices). The main costs are divided as follows (approximate levels): turbine 76 per cent, grid connection 9 per cent and foundations 7 per cent. Other cost components, such as control systems and land, account for a minor share of the total costs. The total cost per kW of installed wind power capacity differs significantly between countries, from around 1,000 €/kW to 1,350 €/kW.
Table S.2: Cost Structure of a Typical 2MW Wind Turbine Installed in Europe (2006-€)
| Investment (€1000/MW) |
Share ( per cent) |
|
| Turbine (ex works) | 928 | 75.6 |
| Foundations | 80 | 6.5 |
| Electric installation | 18 | 1.5 |
| Grid connection | 109 | 8.9 |
| Control systems | 4 | 0.3 |
| Consultancy | 15 | 1.2 |
| Land | 48 | 3.9 |
| Financial costs | 15 | 1.2 |
| Road | 11 | 0.9 |
| Total | 1,227 | 100 |
Note: Calculated by the author based on selected data for European wind turbine installations.
Source: Risø DTU
In recent years, three major trends have dominated the development of grid-connected wind turbines:
- Turbines have become larger and taller;
- The efficiency of turbine production has increased steadily; and
- In general, the investment costs per kW have decreased, although there has been a deviation from this trend in the last three to four years.
In 2007, turbines of with a capacity of over 1 MW represented a market share of more than 95 per cent, leaving less than 5 per cent for the smaller machines. Within the MW-segment, turbines with capacities of 2.5 MW or above are becoming increasingly important, even for onshore sites. The wind regime at the chosen site, the turbine hub height and the efficiency of production determine the turbine’s power production. So simply increasing the height of turbines has resulted in higher power production. Similarly, the methods for measuring and evaluating the wind speed at a given site have improved significantly in recent years, and thus improved the siting and efficiency of new turbines.
Electricity production efficiency has also improved dramatically thanks to to better equipment design. From the late 1980s until 2004, overall investments per unit of swept rotor area decreased by more than two per cent per annum. However, in 2006, total investment costs rose by approximately 20 per cent compared to 2004, mainly due to a marked increase in global demand for wind turbines, combined with rising commodity prices and supply constraints. Preliminary data indicates that prices have continued to rise in 2007. At present, production costs of energy for a 2 MW wind turbine range from 5.3 to 6.1 c€/kWh, depending on the wind resource at the chosen site. According to experience curve analyses, the cost range is expected to decline to between 4.3 and 5.5 c€/kWh by 2015.
Figure S.11: Calculated Costs per kWh of Wind Generated power as a Function of the wWnd Regime at the Chosen Site (Number of Full Load Hours)
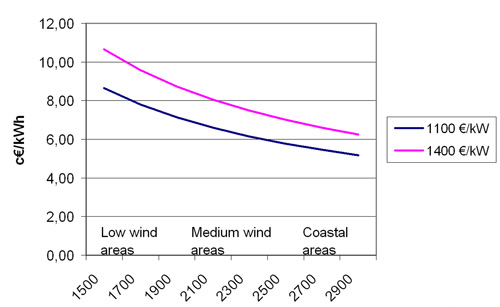
Source: Risø DTU
OFFSHORE DEVELOPMENT
Offshore wind (Chapter III.2) only accounts for around one per cent of total installed wind power capacity in the world, and development has taken place mainly around the North Sea and the Baltic Sea. At the end of 2007, there was a capacity of more than 1000 MW located offshore in five countries: Denmark, Ireland, The Netherlands, Sweden and the UK. Most of the capacity has been installed in relatively shallow water (less than 20m), and no further than 20km from the coast, so as to minimise the costs of foundations and sea cables.
The costs of offshore capacity, like those of onshore turbines, have increased in recent years. On average, investment costs for a new offshore wind farm are expected be in the range of €2.0 to €2.2 million/MW for a near-shore, shallow-depth facility. Compared to land-based turbines, the main differences in the cost structure are related to more expensive foundations, the transformer station and sea transmission cables. The cost of offshore-generated electricity ranges from approximately 6 to 8 c€/kWh mainly due to differences in sea depth, distance from shore and investment costs.
Figure S.12: Calculated Production Cost for Selected Offshore Wind Farms, Including Balancing Costs (2006 Prices)
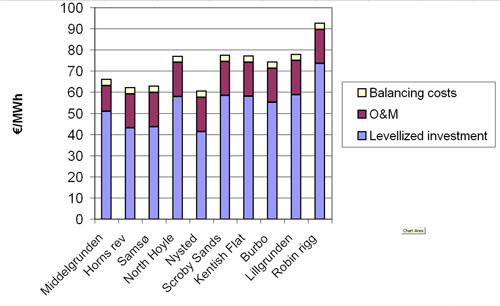
Source: Risø DTU
FINANCE
The nature of business in wind energy is changing. Although there are still many small, privately-owned projects, a substantial shift towards bigger, utility-owned projects can be observed – this is discussed in Chapter III.3. This change brings new money to the industry and decreases dependence on banks for initial funding. Powerful sponsors are also arriving on the scene. Projects are increasing in size and large-scale offshore activity is taking off; since banks favour big projects, this is a change for the better. If the general economic picture deteriorates, project finance may suffer, but the strong political and environmental support for renewable energy means that wind energy funding is still viewed as a very attractive option.
PRICES AND SUPPORT MECHANISMS
When clustering different types of support mechanism for electricity from renewables (RES-E), a distinction is made between direct and indirect policy instruments (Chapter III.4). Direct policy measures attempt to stimulate the immediate installation of RES-E technologies, whereas indirect instruments focus on improving the long-term framework conditions. As well as regulatory instruments, there are also voluntary approaches for the promotion of RES-E technologies, mainly based on the willingness of consumers to pay premium rates for green electricity. Other important classification criteria include whether policy instruments address price or quantity, and whether they support investment or generation.
When reviewing and evaluating the various RES-E support schemes, it is important to assess the success of the different policy instruments according to the following criteria:
- Effectiveness: Did the RES-E support programmes lead to a significant increase in deployment of capacities from RES-E in relation to the additional potential?
- Economic efficiency: What was the absolute support level compared to the actual generation costs of RES-E generators and what was the trend in support over time?
Regardless of whether a national or an international support system is concerned, a single instrument is usually not enough to stimulate the long-term growth of RES-E.
IMPACT OF WIND POWER ON SPOT POWER PRICES
In a number of countries, wind power is increasing its share of total power production (Chapter III.5). This is particularly noticeable in Denmark, Spain and Germany, where wind power’s contribution to total power supply is 21 per cent, 12 percent and 7 per cent respectively. In these cases, wind power is becoming an important player in the power market and can significantly influence power prices. As wind power has very low marginal cost (due to zero fuel costs), it enters near the bottom of the supply curve. This shifts the curve to the right,resulting in lower power prices, with the extent of the price reduction depending on the price elasticity of the power demand.
In general,when wind power provides a significant share of the power supply, the price of power is likely to be lower during high-wind periods and higher during low-wind periods. A study carried out in Denmark shows that the price of power to consumers (excluding transmission and distribution tariffs and VAT and other taxes) in 2004 to 2007 would have been approximately 4–12 per cent higher if wind power had not contributed to power production. This means that in 2007, power consumers saved approximately 0.5 c€/kWh due to wind power reducing electricity prices. This should be compared to consumer payments to wind power of approximately 0.7 c€/kWh as feed-in tariffs. So although the cost of wind power to consumers is still greater than the benefits, a significant reduction in net expenses is certainly achieved due to lower spot prices.
The analysis involves the impacts of wind power on power spot prices being quantified using structural analyses. A reference is fixed, corresponding to a situation with zero contribution from wind power in the power system. A number of levels with increasing contributions from wind power are identified and, relating to the reference, the effect of wind power’s power production is calculated. This is illustrated in the left graph of Figure S.13, where the shaded area between the two curves approximates the value of wind power in terms of lower spot power prices.
Figure S.13: The Impact of Wind Power on the Spot Power Price in the West Denmark Power System in December 2005
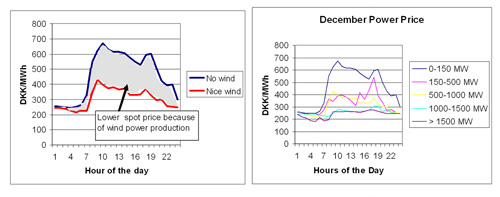
Source: Risø DTU
WIND POWER COMPARED TO CONVENTIONAL POWER
In general, the cost of conventional electricity production is determined by four cost components:
- fuel;
- CO2 emissions (as given by the European Trading System for CO2);
- operation and maintenance (O&M); and
- capital, including planning and site work.
Implementing wind power avoids the full fuel and CO2 costs, as well as a considerable share of conventional power plants’ O&M costs.The amount of capital costs avoided depends on the extent to which wind power capacity can displace investments in new conventional power plants; this is linked directly to how wind power plants are integrated into the power system.
Studies show that the cost of integrating variable wind power is approximately 0.3 to 0.4 c€/kWh of wind power generated, even at fairly high levels of wind power penetration (approximately 20 per cent, depending on the nature of the operating system). Figure S.14 shows the results of the reference case, assuming the two conventional power plants are coming on-stream in 2010.
Figure S.14 Costs of generated power comparing conventional plants to wind power, 2010 (constant 2006-€)
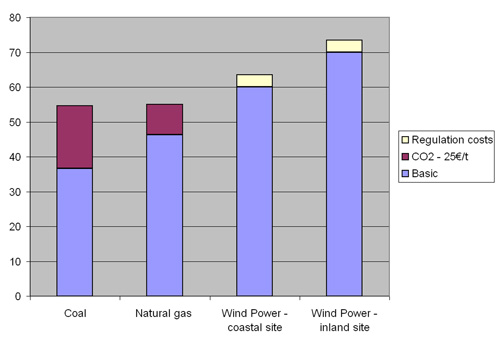
Source: Risø DTU
As shown in the reference case, the cost of power generated at conventional power plants is lower than the cost of wind-generated power under the given assumptions of low fuel prices. At a European inland site, wind-generated power is approximately 33–34 per cent more expensive than natural gas and coal-generated power (Chapter III.6).
This case is based on the World Energy Outlook assumptions on fuel prices, including a crude oil price of US$59/bbl in 2010. At present (mid-2008), the crude oil price has reached as high as $147/bbl. Although this oil price is combined with a lower exchange rate for the US dollar, the present price of oil is significantly higher than the forecasted IEA oil price for 2010. Therefore, a sensitivity analysis has been carried out and the results are shown in Figure S.15.
Figure S.15: Sensitivity Analysis of Costs of Generated Power Comparing Conventional Plants to Wind Power, Assuming Increasing Fossil Fuel and CO2 Prices, 2010 (Constant 2006-€)
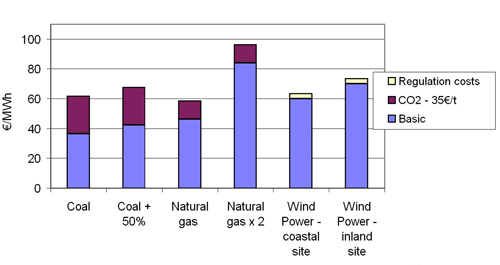
In Figure S.15, the natural gas price is assumed to double compared to the reference (equivalent to an oil price of $118/bbl in 2010), the coal price to increase by 50 per cent and the price of CO2 to increase to €35/t from €25/t in 2008. As shown in the figure, the competitiveness of wind-generated power increases significantly, costs at the inland site becoming lower than those of the natural gas plant and only around10 per cent more expensive than those of the coal-fired plant. On coastal sites wind power produces the cheapest electricity.
EMPLOYMENT
Wind energy companies in the EU currently employ around 108,600 people; when indirect jobs are taken into account, this figure rises to more than 150,000 (Chapter III.7). A significant share of direct wind energy employment (approximately 77 per cent) is located in three countries, Denmark, Germany and Spain, whose combined installed capacity represents 70 per cent of the EU total. However, the sector is less concentrated now than it was in 2003, due to the opening of manufacturing and operation centres in emerging markets and to the fact that many wind-related activities, such as promotion, O&M, engineering and legal services, are now carried out at a local level. Wind turbine and component manufacturers account for most of the jobs (59 per cent).
Table S.3: Direct Employment From Wind Energy Companies in Selected European Countries
| Country | No of direct jobs |
| Austria | 700 |
| Belgium | 2,000 |
| Bulgaria | 100 |
| Czech Republic | 100 |
| Denmark | 23,500 |
| Finland | 800 |
| France | 7,000 |
| Germany | 38,000 |
| Greece | 1,800 |
| Hungary | 100 |
| Ireland | 1,500 |
| Italy | 2,500 |
| The Netherlands | 2,000 |
| Poland | 800 |
| Portugal | 800 |
| Spain | 20,500 |
| Sweden | 2,000 |
| United Kingdom | 4,000 |
| Rest of EU | 400 |
| TOTAL | 108,600 |
Source: Own estimates, based on EWEA (2008a); ADEME (2008); AEE (2007); DWIA (2008);Federal Ministry of the Environment in Germany, BMU (2008)
In addition to the 108,600 direct jobs outlined in the previous section, the European wind energy sector also affects employment in sectors not directly related to wind energy. Approximately 43,000 people were directly employed in wind energy in 2007. EWEA's analysis concludes that 15.1 jobs are created in the EU for each new MW installed. In addition, 0.4 jobs are created per MW of total installed capacity in operations and maintenance and other activities related to existing installations.
| Acknowledgements | Sitemap | Partners | Disclaimer | Contact | ||
|
coordinated by |
supported by  |
The sole responsibility for the content of this webpage lies with the authors. It does not necessarily reflect the opinion of the European Communities. The European Commission is not responsible for any use that maybe made of the information contained therein. |
