MAIN PUBLICATION :
| Home � INDUSTRY & MARKETS � Wind in the European power... � The EU energy mix |

|
The EU Energy Mix
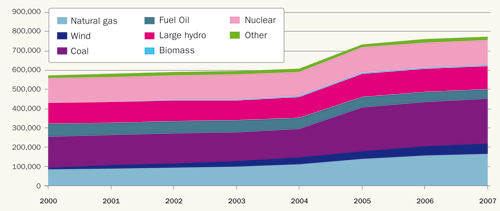
While thermal generation totalling over 430 GW, combined with large hydro and nuclear, has long served as the backbone of Europe’s power production, Europe is steadily making the transition away from conventional power sources and towards renewable energy technologies. Between 2000 and 2007, the total EU power capacity increased by 200 GW to reach 775 GW by the end of 2007. The most notable change in the capacity is the near doubling of gas capacity to 164 GW. Wind energy more than quadrupled from 13 GW to 57 GW.
The addition of ten new Member States in May 2004 put another 112 GW into the EU generation mix, including 80 GW of coal, 12 GW of large hydro, 12 GW of natural gas, 6.5 GW of nuclear and 186 MW of wind power.
Figure 1.1: Installed Power Capacity EU 2000-2007 (in MW)
Source: EWEA and Platts (2008)
Changes in net installed capacity for the various electricity generating technologies are shown in Figure 1.3. The figures include the EU-10 (ten new member states) as from 2005 and EU-12 as from 2007. The growth of natural gas and wind power has taken place at the expense of fuel oil, coal and nuclear power. In 2007, 21.2 GW of new capacity was installed in the EU-27, of which 10.7 GW was gas (50 per cent) and 8.6 GW was wind power (40 per cent)
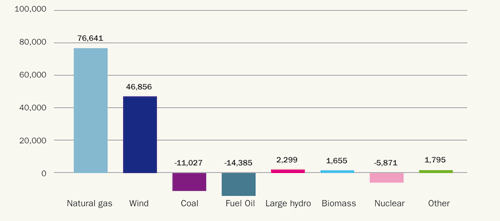
Gas and wind power also lead in terms of new capacity if decommissioning of old capacity is taken into account. Net installation of power capacity in the EU totalled 98 GW between 2000 and 2007. Gas and wind power accounted for 77 GW and 47 GW respectively while more oil (-14 GW net), coal (-11 GW net) and nuclear (-6 GW net) have been removed than installed since 2000.
Figure 1.2: Net Increase/Decrease in Power Capacity EU 2000-2007 (in MW)
Source: EWEA and Platts (2008)
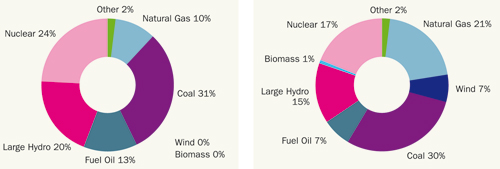
The share of EU capacity covered by natural gas has more than doubled since 1995 to reach 21 per cent. Coal’s share is unchanged while oil, large hydro and nuclear have all decreased their share. Wind energy’s share has increased from 0 per cent in 1995 to 7 per cent in 2007.
The obstacles hindering more combined cycle gas turbine plant installations, including the rising costs of gas and volatile supply security from Russia and the Middle East, are most acutely felt in highly import-dependent countries such as Italy, the Netherlands and Portugal.
Figure 1.3: Evolution of EU Energy Mix (1995 versus 2007)
Source: EWEA and Platts (2008)
Nuclear accounts for around 17 per cent of the total installed capacity in Europe. While nuclear power emits only low amounts of carbon, safety concerns and costs remain key obstacles. Most of Europe stopped adding nuclear generation capacity in the 1980s, and several countries face major decommissioning programmes over the next ten years, and looming capacity gaps to fill. In Germany alone, over 20 GW of nuclear capacity stands to be decommissioned by 2020, while France’s 63 GW installed base will also require modernisation. At present, there is just one nuclear reactor currently under construction in the EU, in Finland, and this will add less than 5 GW to the country’s capacity in the medium term.
Against this backdrop of rising costs and emissions for heavily thermal-dependant Europe, with its significant resistance to new nuclear construction, renewable energy technologies have been able to flourish in the past ten years. Europe’s renewables targets, and the need to fill the generation gap, have resulted in a mix of support mechanisms for key technologies, including wind energy, biomass, solar, small hydro, ocean energy, and geothermal. These generation options have resulted in a race to position these technologies as cost-competitive options for national energy mixes, with wind clearly in the lead.
The European Commission expects a 76 per cent decline in EU oil production between 2000 and 2030. Gas production will fall by 59 per cent and coal by 41 per cent. By 2030, the EU will be importing 95 per cent of its oil, 84 per cent of its gas and 63 per cent of its coal.
| Acknowledgements | Sitemap | Partners | Disclaimer | Contact | ||
|
coordinated by  |
supported by  |
The sole responsibility for the content of this webpage lies with the authors. It does not necessarily reflect the opinion of the European Communities. The European Commission is not responsible for any use that maybe made of the information contained therein. |


