MAIN PUBLICATION :
| Home � ECONOMICS � Cost of on-land wind power � Future evolution of the costs of wind-generated power |

|
Future Evolution of the Costs of Wind-Generated Power
In this section, the future development of the economics of wind power is illustrated by the use of the experience curve methodology. The experience curve approach was developed in the 1970s by the Boston Consulting Group; it relates the cumulative quantitative development of a product to the development of the specific costs (Johnson, 1984). Thus, if the cumulative sale of a product doubles, the estimated learning rate gives the achieved reduction in specific product costs.
The experience curve is not a forecasting tool based on estimated relationships. It merely shows that if the existing trends continue in the future, the proposed development may be seen. It converts the effect of mass production into an effect upon production costs, without taking other causal relationships into account. Thus changes in market development and/or technological breakthroughs within the field may change the picture considerably, as would fluctuations in commodity prices such as those for steel and copper.
Different experience curves have been estimated for a number of projects. Unfortunately, different specifications were used, which means that not all of these projects can be directly compared. To obtain the full value of the experiences gained, the reduction in price of the turbine (€/KW-specification) should be taken into account, as well as improvements in the efficiency of the turbine’s production (which requires the use of an energy specification (€/kWh), see Neij et al. 2003). Thus, using the specific costs of energy as a basis (costs per kWh produced), the estimated progress ratios range from 0.83 to 0.91, corresponding to learning rates of 0.17 to 0.09. So when the total installed capacity of wind power doubles, the costs per kWh produced for new turbines goes down by between 9 and 17 per cent. In this way, both the efficiency improvements and embodied and disembodied cost reductions are taken into account in the analysis.
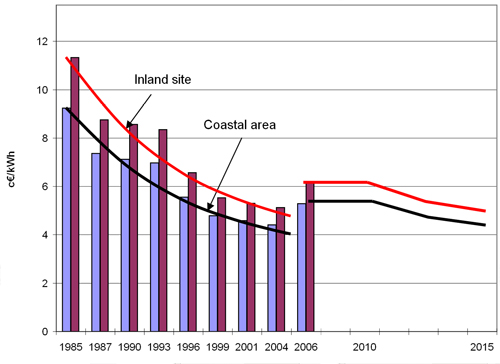
Wind power capacity has developed very rapidly in recent years, on average by 25-30 per cent per year over the last ten years. At present, the total wind power capacity doubles approximately every three to four years. Figure 1.11 shows the consequences for wind power production costs, based on the following assumptions:
- The present price-relation should be retained until 2010; the reason why no price reductions are foreseen in this period is due to a persistently high demand for new wind turbine capacity, and sub-supplier constraints in the delivery of turbine components;
- From 2010 until 2015, a learning rate of 10 per cent is assumed, implying that each time the total installed capacity doubles, the costs per kWh of wind generated power decrease by 10 per cent; and
- The growth rate of installed capacity is assumed to double cumulative installations every three years.
The curve illustrates cost development in Denmark, which is a fairly cheap wind power country. Thus, the starting point for the development is a cost of wind power of around 6.1 c€/kWh for an average 2 MW turbine sited at a medium wind regime area (average wind speed of 6.3 m/s at a hub height of 50m). The development for a coastal position is also shown.
Figure 1.11: Using Experience Curves to Illustrate the Future Development of Wind Turbine Economics until 2015.
Note: Costs are illustrated for an average 2 MW turbine installed either at an inland site or at a coastal position.
Source: Risø DTU
At present, the production costs for a 2 MW wind turbine installed in an area with a medium wind speed (inland position) are around 6.1 c€ per kWh of wind-produced power. If sited at a coastal position, the current costs are around 5.3 c€/kWh. If a doubling time of total installed capacity of three years is assumed, in 2015 the cost interval would be approximately 4.3 to 5.0 c€/kWh for a coastal and inland site respectively. A doubling time of five years would imply a cost interval, in 2015, of 4.8 to 5.5 c€/kWh. As mentioned, Denmark is a fairly cheap wind power country; for more expensive countries the cost of wind power produced would increase by 1- 2 c€/kWh.
| Acknowledgements | Sitemap | Partners | Disclaimer | Contact | ||
|
coordinated by  |
supported by  |
The sole responsibility for the content of this webpage lies with the authors. It does not necessarily reflect the opinion of the European Communities. The European Commission is not responsible for any use that maybe made of the information contained therein. |

