MAIN PUBLICATION :
| Home � ENVIRONMENT � Environmental benefits � Comparative benefits |

|
Comparative Benefits with Conventional and Renewable Technologies Systems
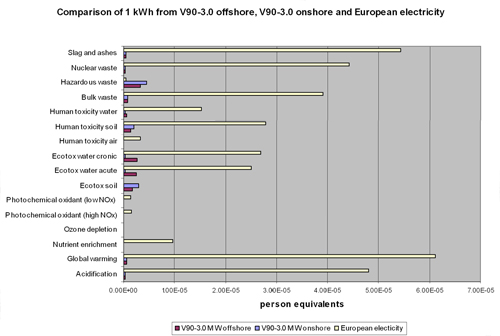
Several studies have been conducted from different institutions and enterprises in order to quantify the environmental impacts of energy systems. The Vestas study also analysed the environmental impacts produced by average European electricity in 1990, using data from the Danish method for environmental design of industrial products (EDIP) database, compared with the electricity generated by an offshore wind power plant and an onshore wind power plant. The comparison shows that wind electricity has a much better environmental profile than the average Danish electricity for the year of the project. The impacts are considerably lower in case of wind energy than European electricity in all the analysed impacts categories. However, the comparison is not quite fair, as the system limits of the two systems differ from each other. The comparison was made to see the order of magnitude (See Figure 1.14).
Figure 1.14. Onshore, Offshore and Electricity System Comparison on Environmental Impacts

Source: Vestas Wind System A/S
Vattenfall Nordic Countries have carried out LCAs of its electricity generation systems. The results of the study showed that:
- Construction is the most polluting phase for the technologies that do not require fuel, but instead use a renewable source of energy (hydro, wind and solar power).
- The operational phase dominates for all fuel-burning power plants, followed by fuel production.
- Wind energy generates low environmental impact in all the parameters analysed: CO2, NOx, SO2 and particulate matter emissions and radioactive waste. Only the use of copper from mines presents a significant impact.
- The demolition/dismantling phase causes a comparatively low impact since, for example, metals and concrete can be recycled.
AVOIDED EMISSIONS
Environmental benefits of wind electricity can be assessed in terms of avoided emissions compared to other alternative electricity generation technologies.
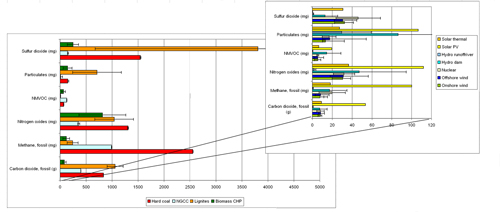
LCI results for some relevant emissions from electricity production in a coal condensing power plant and in a natural gas combined cycle power plant are shown in Figure 1.15 compared with the results obtained for onshore and offshore wind energy.
Figure 1.15. Comparison of the Emissions Produced in the Generation of 1 kWh in a Coal and a Natural Gas Combined Cycle Power Plant and the Emissions Produced in an Onshore and Offshore Wind Farm

Source: Results from CASES, Ecoinvent and NEEDS for the coal and natural gas power plants.
As observed in Figure 1.15, emissions produced in the life cycle of wind farms are well below those produced in competing electricity generation technologies such as coal and gas. The only exception is the emissions of particles in the natural gas combined cycle (NGCC) which are of the same order of those from wind farms along the whole life cycle.
Emissions avoided using wind farms to produce electricity instead of coal or natural gas power plants are quantified in tables 1.2 and 1.3.
Table 1.2. Emissions of Relevant Pollutants Produced by Wind Electricity and Coal and Natural Gas Electricity Along the Whole Life Cycle, and Benefits of Wind versus Coal and Natural Gas
| Emissions | Benefits | ||||||||
| Onshore wind | Offshore wind | Average wind | Hard coal | Lignite | NGCC | vs. coal | vs. Lignite | vs. NGCC | |
| Carbon dioxide, fossil (g) | 8 | 8 | 8 | 836 | 1060 | 400 | 828 | 1051 | 391 |
| Methane, fossil (mg) | 8 | 8 | 8 | 2554 | 244 | 993 | 2546 | 236 | 984 |
| Nitrogen oxides (mg) | 31 | 31 | 31 | 1309 | 1041 | 353 | 1278 | 1010 | 322 |
| NMVOC (mg) | 6 | 5 | 6 | 71 | 8 | 129 | 65 | 3 | 123 |
| Particulates (mg) | 13 | 18 | 15 | 147 | 711 | 12 | 134 | 693 | -6 |
| Sulphur dioxide (mg) | 32 | 31 | 32 | 1548 | 3808 | 149 | 1515 | 3777 | 118 |
Results show that as much as 828 g of CO2 can be avoided per kWh produced by wind instead of coal, and 391 g of CO2 per kWh in the case of natural gas. Quite significant nitrogen and sulphur oxides and NMVOC emission reductions can also be obtained by substituting coal or gas with wind energy.
Table 1.3. Emissions and Benefits of Relevant Pollutants Produced by Wind Electricity and other Renewable Energies
| Emissions | Benefits | ||||||||||||||||||||||||||||||||||||||||||||||||||||||||||
| vs. Nuclear | Average wind | Nuclear | Solar PV | Solar thermal | Biomass CHP | vs. Nuclear | vs. Solar PV | vs. Solar thermal | vs. Biomass CHP | ||||||||||||||||||||||||||||||||||||||||||||||||||
| Carbon dioxide, fossil (g) | 8 | 8 | 53 | 9 | 83 | 0 | 45 | 1 | 75 | Methane, fossil (mg) | 8 | 20 | 100 | 18 | 119 | 12 | 92 | 10 | 111 | Nitrogen oxides (mg) | 31 | 32 | 112 | 37 | 814 | 1 | 81 | 6 | 784 | NMVOC (mg) | 6 | 6 | 20 | 6 | 66 | 0 | 14 | 1 | 60 | Particulates (mg) | 15 | 17 | 107 | 27 | 144 | 1 | 91 | 12 | 128 | Sulphur dioxide (mg) | 32 | 46 | 0 | 31 | 250 | 15 | -31 | -1 | 218 |
As in the case of fossil energies, wind energy results show in general lower emissions of CO2, methane, nitrogen and sulphur oxides, NMVOC's and particulates than other renewable sources. In this sense, it is possible to obtain avoided emissions, using wind (onshore and offshore) technologies in the power generation system.
| Acknowledgements | Sitemap | Partners | Disclaimer | Contact | ||
|
coordinated by  |
supported by  |
The sole responsibility for the content of this webpage lies with the authors. It does not necessarily reflect the opinion of the European Communities. The European Commission is not responsible for any use that maybe made of the information contained therein. |
