MAIN PUBLICATION :
| Home � TECHNOLOGY � Research and Development � R&D funding for wind energy � Support for wind R&D at MemberStatelevel |

|
Support for Wind R&D at Member State Level
The data discussed below have been sourced from the IEA’s Energy R&D Statistics Database. R&D budgets for the period 1974-2005 are available for 19 EU countries: Austria, Belgium, Czech Republic, Denmark, Finland, France, Germany, Greece, Hungary, Ireland, Italy, Luxembourg, The Netherlands, Norway, Portugal, Spain, Sweden, Switzerland, and the UK.
Figure 7.4 illustrates the evolution of total funding for wind R&D during the period 1974-2006 (excluding EC funding). The total available budget peaked in 1985, with a significant budget available in The Netherlands, accounting for 46 per cent of the total.
The total available budget in 2003 was 48 per cent of this peak, and decreased to 37 per cent in 2004 (though for 2004, data from The Netherlands are not available). In 2005, a significant budget increase can be noticed, with the R&D budget in the UK increasing by a factor of 10. In 2006, the total available budget for wind R&D was 41 per cent of the 1985 maximum – and 60 per cent of TPWind’s requirements.
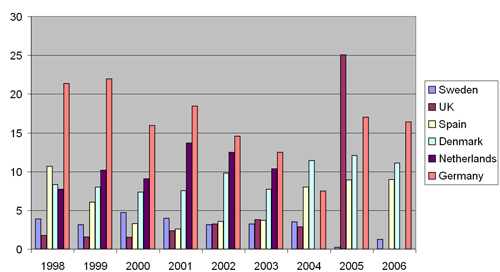
For the period 1998-2006, these budget variations are highlighted in Figure 7.5 for the six main contributing countries. Germany was the main contributor to R&D funding for wind energy, which is consistent with its world-leading position in installed wind power capacity and world manufacturing capacity. After a decrease in funding by a third in 2004, Germany made a significant effort in 2005 and 2006. For 2005, the budget contribution of the UK, however, far exceeded any other.
These strong budget variations prevent the sector from relying on the material research support scheme. Ambitious long-term research programmes, involving heavy research facilities, are therefore risky.
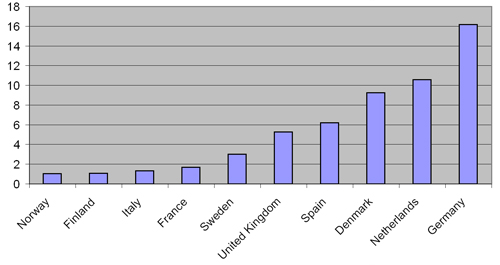
Figure 7.6 shows the average R&D budget for the period 1998-2006 for countries with a significant budget (the seven countries above EUR1 Million on average). Only six of these countries have an average budget that exceeded EUR3 million a year and only these six main contributors were able to set up research laboratories and test facilities that were recognised worldwide, and/or world-leading turbine or component manufacturers. These figures clearly demonstrate that a high-quality research structure is built on long-term, high-level R&D budgets.
Figure 7.4: State R&D Funding for Wind Energy (in € million-2006)
Source: EWEA
Figure 7.5: Wind R&D Budget Evolution for Countries with Average Budget Above EUR3m/year (1998-2006, in €million-2006)
Source: EWEA
Figure 7.6: Average Funding, 1998-2006, for Countries with an Average Budget Above €1m/year (in €million-2006)
Source: EWEA
| << Support at EC level | Current effort from the private sector >> |
| Acknowledgements | Sitemap | Partners | Disclaimer | Contact | ||
|
coordinated by  |
supported by  |
The sole responsibility for the content of this webpage lies with the authors. It does not necessarily reflect the opinion of the European Communities. The European Commission is not responsible for any use that maybe made of the information contained therein. |


