MAIN PUBLICATION :
| Home � INDUSTRY & MARKETS � Industry actors... � Industry scales by project, turbine size |

|
Industry Scales by Project and Turbine Size
The average size of wind projects is steadily increasing as wind becomes more integrated into the generation portfolios of leading utilities and IPPs that are looking to realise economies of scale. At the same time, project installation sizes are highly sensitive to local market and site restrictions, leading to wide discrepancies in average project sizes in the various European markets. There are several key trends for the different project segments:
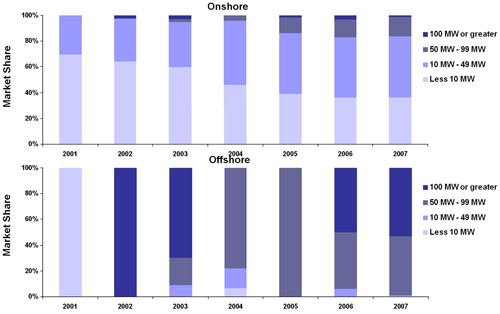
- Projects of under 20 MW were the mainstay of European wind development, particularly in Germany, until 2004, when larger-scale markets like Spain, Portugal and the UK began growing in volume. These projects now represent less than 40 per cent of annual added capacity; however, this size of project remains important in tapping remaining market potential.
- Europe is seeing increasing saturation onshore in terms of mid-sized projects in the 20-50 MW range. While projects this size will maintain Europe’s share of the global market, several coastal markets, led by the UK and Germany, are moving offshore for 100 MW and larger projects. Europe’s steady growth onshore with average project sizes of 20-30 MW is likely to continue in the near term.
- At the same time, 50-99 MW projects have gradually increased their market share, reaching nearly 20 per cent of the market by 2007. Projects of this size often obtain the necessary permits more quickly from national level.
- Based on installations in 2007, offshore projects look to be evolving towards the 60-200 MW range. 50-99 MW projects represent an intermediate phase of market development between pilot and large-scale developments, as observed in the UK, and will serve as a means for initiating larger installations in several markets.
Fig 3.7: Europe Onshore, Offshore Project Size Overview
Source: Emerging Energy Research
As the global pioneer in wind turbine technology, Europe has seen a rapid increase in average turbine size, reaching multi-megawatt capacities. European markets have served as a base in establishing a track record for larger turbine deployment. However, suppliers look to continue maximising investments in workhorse product platforms of under 2 MW where possible. Key trends include:
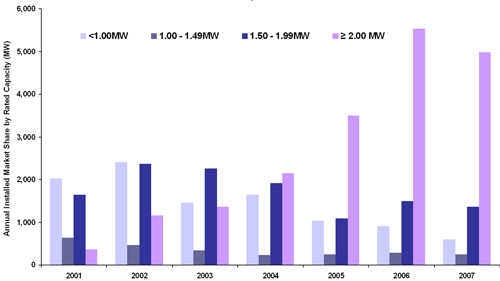
- Turbines of under 1 MW are the most proven models of the majority of turbine suppliers, and installations peaked in 2004 with major deliveries in Southern Europe. Since then, the introduction of more advanced systems with larger rotors has moved the industry towards higher-capacity machines. However, bigger is not always better, as O&M track records and performance are generally better understood with machines in the lower capacity segment.
- 1 MW to 1.49 MW turbines carved out a niche in Europe with a few suppliers, for 3 per cent of annual European MW installations. However, the industry’s trend toward multi-megawatt machines has reduced demand as greater output at the same sites can be captured with 1.5 MW and larger models. The segment has now dropped to under 500 MW of annual installations as suppliers seek to push their larger platforms.
- 1.50 MW to 1.99 MW turbine installations peaked in 2002 and have generally levelled off at around 1,500 MW of capacity installed in the past three years. This segment saw a major drop in demand from over 30 per cent to less than 20 per cent of installations between, 2004 and 2005, as leading suppliers and new entrants have pushed 2 MW and larger models into serial production.
- 2 MW and larger turbines have become virtually standard in Europe since 2005, when this size machine jumped to over half of total installations in terms of megawatts. This surge continued in 2006 as the amount of MW installed in turbines this size pushed well past 5 GW. While 2007 saw the segment hit more severely by component shortages, Europe continues to rely on these larger turbines for the bulk of its installations.
Fig 3.8: Europe MW Installed by Turbine Size, 2001-2008
Source: Emerging Energy Research.
| Acknowledgements | Sitemap | Partners | Disclaimer | Contact | ||
|
coordinated by  |
supported by  |
The sole responsibility for the content of this webpage lies with the authors. It does not necessarily reflect the opinion of the European Communities. The European Commission is not responsible for any use that maybe made of the information contained therein. |


