MAIN PUBLICATION :
| Home � INDUSTRY & MARKETS � European market overview |

|
CHAPTER 2: EUROPEAN MARKET OVERVIEW
The Current Status of the EU Wind Energy Market
Wind has become an integral part of the generation mix of markets like Germany, Spain, and Denmark alongside conventional power sources. Nonetheless, it continues to face the double challenge of competing against other technologies while proving itself as a sound energy choice for large power producers seeking to enlarge and diversify their portfolios.
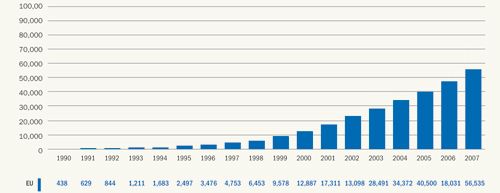
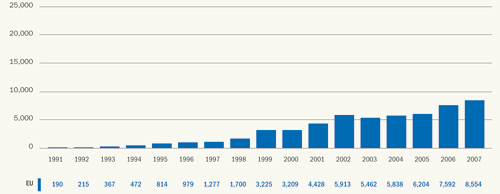
By the end of 2007, there was 56,535 MW of wind power capacity installed in the EU-27, of which 55,860 MW was in the EU-15. In EWEA’s previous scenario, drawn up in October 2003, we expected 54,350 MW to be installed in the EU-15 by the end of 2007. Thus the total capacity was underestimated by 1,510 MW over the five-year period. In 2003, EWEA expected total annual installations in 2007 to be 6,600 MW, whereas the actual market was significantly higher, at 8,291 MW in the EU-15 (8,554 MW in the EU-27).
In the EU, installed wind power capacity has increased by an average of 25 per cent annually over the past eleven years, from 4,753 MW in 1997 to 56,535 MW in 2007. In terms of annual installations, the EU market for wind turbines has grown by 19 per cent annually, from 1,277 MW in 1997 to 8,554 MW in 2007.
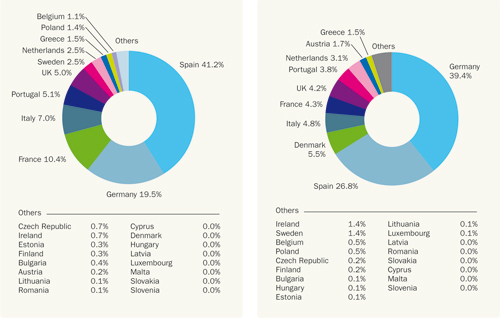
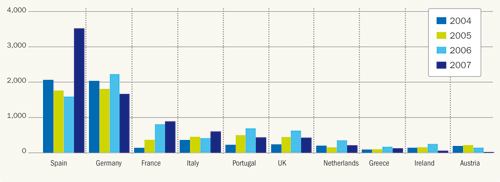
In 2007, Spain (3,522 MW) was by far the largest market for wind turbines, followed by Germany (1,667 MW), France (888 MW) and Italy (603 MW). Eight countries – Germany, Spain, Denmark, Italy, France, the UK, Portugal and the Netherlands – now have more than 1,000 MW installed. Germany, Spain and Denmark – the three pioneering countries of wind power – are home to 72 per cent of installed wind power capacity. That share is expected to decrease to 62 per cent of installed capacity in 2010.
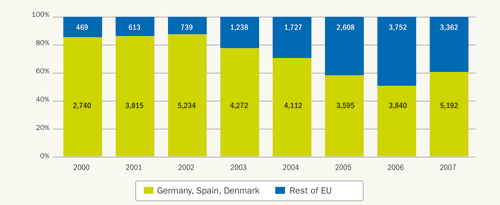
Germany and Spain continue to attract the majority of investments. In 2007, these two countries represented 61 per cent of the EU market. However, there is a healthy trend towards less reliance on Germany and Spain, although this trend was broken in 2007 due to unprecedented Spanish growth. In 2000, 468 MW of European wind power capacity was installed outside Germany, Spain and Denmark; in 2007, the figure was 3,362 MW.
Figure 2.1: European Cumulative Wind Power Capacity 1990-2007 (in MW)
Source: EWEA
Figure 2.2: Global Annual Wind Power Capacity 1991-2007 (in MW)
Source: EWEA
Figure 2.3 (left): 2007 Member State Market Shares for New Capacity
Figure 2.4 (right): End 2007 Member State Market Shares for Total Capacity
Source: EWEA
Table 2.1: Cumulative Installations of Wind Power in the EU (MW) and Predictions for 2010
Country 2000 2001 2002 2003 2004 2005 2006 2007 2010 Austria 77 94 140 415 606 819 965 982 1200 Belgium 13 32 35 68 96 167 194 287 800 Bulgaria 10 10 36 70 200 Cyprus 0 0 0 0 0 0 0 Czech Republic 3 9 17 28 54 116 250 Denmark 2417 2489 2889 3116 3118 3128 3136 3125 4150 Estonia 2 2 6 32 32 58 150 Finland 39 39 43 52 82 82 86 110 220 France 66 93 148 257 390 757 1567 2454 5300 Germany 6113 8754 11994 14609 16629 18415 20622 22247 25624 Greece 189 272 297 383 473 573 746 871 1500 Hungary 3 3 3 17 61 65 150 Ireland 118 124 137 190 339 496 746 805 1326 Italy 427 682 788 905 1266 1718 2123 2726 4500 Latvia 24 27 27 27 27 27 100 Lithuania 0 0 6 6 48 50 100 Luxembourg 10 15 17 22 35 35 35 35 50 Malta 0 0 0 0 0 0 0 Netherlands 446 486 693 910 1079 1219 1558 1746 3000 Poland 27 63 63 83 153 276 1000 Portugal 100 131 195 296 522 1022 1716 2150 3500 Romania 1 1 1 2 3 8 50 Slovakia 0 3 5 5 5 5 25 Slovenia 0 0 0 0 0 0 25 Spain 2235 3337 4825 6203 8264 10028 11623 15145 20000 Sweden 231 293 345 399 442 510 571 788 1665 UK 406 474 552 667 904 1332 1962 2389 5115 EU Accumulated* 12,887 17,315 23,098 28,491 34,372 40,500 48,031 56,535 80,000 Source: EWEA
Excluding Germany, Spain and Denmark, there has been an almost fivefold increase in the annual market in the past five years, confirming that a second wave of European countries are investing in wind power, partly as a result of the EU Renewable Electricity Directive of 2001.
Figure 2.5: Germany, Spain and Denmark’s Share of the EU Market 2000-2007 (in MW)
Source: EWEA
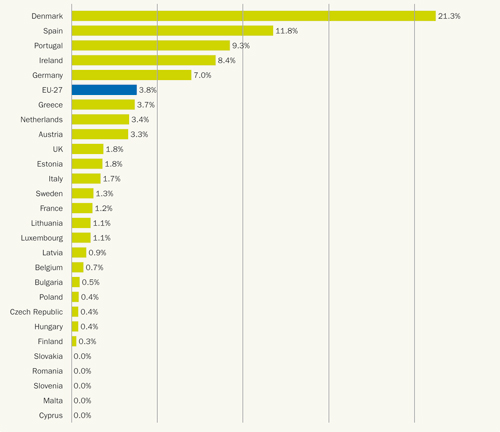
The total wind power capacity installed at the end of 2007 will produce 3.7 per cent of the EU-27 electricity demand in a normal wind year. Wind power in Denmark covers more than 20 per cent of its total electricity consumption, by far the largest share of any country in the world. Five EU countries - Denmark, Spain, Portugal, Ireland, and Germany – have more than 5 per cent of their electricity demand met by wind energy (Figure 2.6).
Figure 2.6: Wind Power’s Share of National Electricity Demand
Source: EWEA
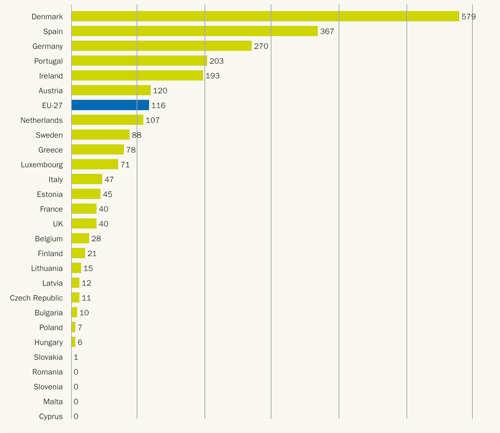
By the end of 2007, 116 kW of wind energy capacity was installed for every 1,000 people in the EU. Denmark tops the list with 579 kW/1,000 people followed by Spain (367 kW) and Germany (270 kW). If all EU countries had installed the same amount of wind power capacity per population as Spain, the total installed capacity in the EU would be 180,000 MW, equal to EWEA’s 2020 target. If all EU countries had the same amount of capacity per capita as Denmark, total EU installations would be 282,000 MW, slightly less than the EWEA 2030 target.
Figure 2.7: Installed Wind Capacity – kW/1,000 Inhabitants
Source: EWEA
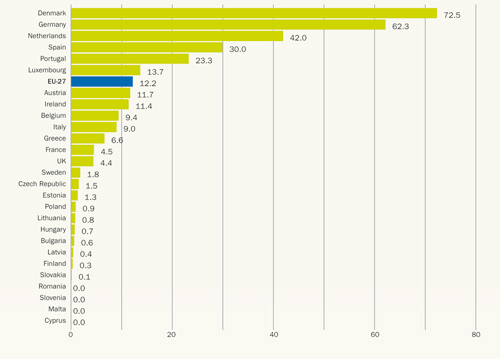
There is 12.2 MW of wind power capacity installed per 1,000 km2 of land area in the EU. Not surprisingly, being a small country, wind power density is highest in Denmark, but Germany comes a close second. It is interesting that Spain’s wind power density is less than half that of Germany, indicating a large remaining potential - at least from a visual perspective. The Netherlands, Portugal and Luxembourg are also above the EU average.
Many geographically large Member States, such as France, Sweden, Finland, Poland and Italy, still have very low density compared with the first-mover countries. If Sweden had the same wind power density as Germany, there would be more than 28 GW of wind power capacity installed in Sweden (0.8 GW was operating by end 2007) and France would have more than 34 GW of wind power capacity (compared to 2.5 GW in December 2007).
Figure 2.8: Wind Installation MW/1,000 km2
Source: EWEA
Figure 2.9: Top 10 Annual Markets in the EU (MW)
Source: EWEA
Summary of the Wind Energy Market in the EU-27 in 2007
- 56 GW installed capacity, including 1.08 GW offshore
- Annual installations of 8.5 GW, including 0.2 GW offshore
- Electricity production of 119 TWh, including 4 TWh offshore
- Meeting 3.7 per cent of total EU electricity demand.
- 40.3 per cent of the annual new electricity generating capacity
- 55 per cent of annual net increase in installed electricity generating capacity
- 7.3 per cent of total installed electricity generating capacity
- Providing power equivalent to the needs of 30 million average EU households (15 per cent of EU households)
- Annual avoided fuel costs of €3.9 billion
- Annual investments in wind turbines of € 11.3 billion
- Total life-time avoided fuel costs of wind power capacity installed in 2007 of €16 billion (assuming fuel prices equivalent to $90 a barrel of oil)
- Total life-time avoided CO2 cost of wind power capacity installed in 2007 of €6.6 billion (assuming CO2 price of €25/t)
- European manufacturers have a 75 per cent share of the global market for wind turbines (2006)
| Acknowledgements | Sitemap | Partners | Disclaimer | Contact | ||
|
coordinated by  |
supported by  |
The sole responsibility for the content of this webpage lies with the authors. It does not necessarily reflect the opinion of the European Communities. The European Commission is not responsible for any use that maybe made of the information contained therein. |
