MAIN PUBLICATION :
| Home � SCENARIOS & TARGETS � The Global Wind Energy... � Chapter 6: The �Global Wind Energy Outlook� scenarios |

|
CHAPTER 6: THE 'GLOBAL WIND ENERGY OUTLOOK' SCENARIOS
The Global Wind Energy Outlook scenarios as presented by GWEC and Greenpeace (GWEC/Greenpeace, 2008) examine the future potential of wind power up to 2030, starting from a range of assumptions which will influence the development of the wind industry.
This exercise has been carried out jointly by GWEC, Greenpeace International and the German Aerospace Centre (DLR). Projections on the future of wind energy development have been extrapolated from a larger study of global sustainable energy pathways up to 2030, conducted by DLR for Greenpeace and the European Renewable Energy Council (EREC).
Scenario Methodology
REFERENCE SCENARIO
There are three different Global Wind Energy Outlook scenarios looking at the future growth of wind energy around the world. The most conservative ‘reference’ scenario is based on the projections in the World Energy Outlook 2007 report from the IEA. This only takes existing energy policies into account, though including assumptions such as continuing electricity and gas market reform, the liberalisation of cross-border energy trade, and recent policies aimed at combating pollution. Based on the IEA’s figures, the scenario then projects the growth of wind power up to 2030.
MODERATE SCENARIO
The ‘moderate’ scenario takes into account all existing or planned policy measures from around the world that support renewable energy. It also assumes that the targets set by many countries for either renewables or wind energy are successfully implemented. Moreover, it assumes renewed investor confidence in the sector established by a successful outcome from the current round of climate change negotiations, which are set to culminate at the UNFCCC COP 15 in Copenhagen in December 2009.
ADVANCED SCENARIO
The most ambitious scenario, the ‘advanced’ version examines the extent to which this industry could grow in a best-case ‘wind energy vision’. The assumption here is that all policy options in favour of renewable energy, following the industry’s recommendations, have been selected, and that the political will is there to carry them out.
Up to 2012, the figures for installed capacity are closer to being forecasts than scenarios. This is because the data available from the wind energy industry shows the expected growth of worldwide markets over the next five years based on orders for wind turbines that have already been received. After 2012, the pattern of development is clearly much more difficult to predict. Nonetheless, the scenario still shows what could be achieved if the wind energy market is given the encouragement it deserves.
Energy Efficiency Projections
These three scenarios for the global wind energy market are then set against two projections for the future growth of electricity demand. Most importantly, these projections do not just assume that growing demand by consumers will inevitably need to be matched by supply options. On the basis that demand will have to be reduced if the threat of climate change is to be seriously tackled, they take into account an increasing element of energy efficiency.
The more conservative of the two global electricity demand projections is again based on data from the IEA’s World Energy Outlook 2007, extrapolated forwards to 2050. This is the ‘reference’ projection. It does not take into account any possible or likely future policy initiatives and assumes, for instance, that there will be no change in national policies on nuclear power. The IEA’s assumption is that ‘in the absence of new government policies, the world’s energy needs will rise inexorably’. Global demand would therefore almost double from the baseline 12,904 TWh in 2002 to reach 29,254 TWh by 2030 and continue to grow to 42,938 TWh by 2050.
The IEA’s expectations on rising energy demand are then set against the outcome of a study on the potential effect of energy-efficiency savings developed by DLR and the Ecofys consultancy. The study describes an ambitious development path for the exploitation of energy-efficiency measures. It focuses on current best practice and available technologies in the future, and assumes that continuous innovation takes place. The most important sources of energy saving are in efficient passenger and freight transport and in better insulated and designed buildings: together these account for 46 per cent of worldwide energy savings.
Under the ‘high energy efficiency’ projection, input from the DLR/Ecofys models shows the effect of energy efficiency savings on the global electricity demand profile. Although this assumes that a wide range of technologies and initiatives have been introduced, their extent is limited by the potential barriers of cost and other likely roadblocks. This still results in global demand increasing by much less than under the reference projection, to reach 21,095 TWh in 2030. By the end of the scenario period in 2050, demand is 35 per cent lower than under the reference scenario.
Main Assumptions and Parameters
GROWTH RATES
Market growth rates in this scenario are based on a mixture of historical figures and information obtained from analysts of the wind turbine market. Annual growth rates of more than 20 per cent per annum, as envisaged in the advanced version of the scenario, are high for an industry which manufactures heavy equipment. The wind industry has experienced much higher growth rates in recent years, however. In the five years up to 2007 the average annual increase in global cumulative installed capacity was 25 per cent.
It should also be borne in mind that, whilst growth rates eventually decline to single figures across the range of scenarios, the level of wind power capacity envisaged in 40 years’ time means that even small percentage growth rates will by then translate into large figures in terms of annually installed megawatts.
TURBINE CAPACITY
Individual wind turbines have been steadily growing in terms of their nameplate capacity – the maximum electricity output they can achieve when operating at full power. The average nameplate capacity of wind turbines installed globally in 2007 was 1.49 MW. The largest turbines on the market are now 6 MW in capacity.
GWEC’s scenarios make the conservative assumption that the average size will gradually increase from today’s figure to 2 MW in 2013 and then level out. It is possible, however, that this figure will turn out to be greater in practice, requiring fewer turbines to achieve the same installed capacity. It is also assumed that each turbine will have an operational lifetime of 20–25 years, after which it will need to be replaced. This ‘repowering’ or replacement of older turbines has been taken into account in the scenarios.
CAPACITY FACTORS
‘Capacity factor’ refers to the percentage of its nameplate capacity that a turbine installed in a particular location will deliver over the course of a year. This is primarily an assessment of the wind resource at a given site, but capacity factors are also affected by the efficiency of the turbine and its suitability for the particular location. As an example, a 1 MW turbine operating at a 25 per cent capacity factor will deliver 2190 MWh of electricity in a year.
From an estimated average capacity factor today of 25 per cent, the scenario assumes that improvements in both wind turbine technology and the siting of wind farms will result in a steady increase. Capacity factors are also much higher out to sea, where winds are stronger and more constant. The growing size of the offshore wind market, especially in Europe, will therefore contribute to an increase in the average. The scenario foresees the average global capacity factor increasing to 28 per cent by 2012.
CAPITAL COSTS AND PROGRESS RATIOS
The capital cost of producing wind turbines has fallen steadily over the past 20 years, as manufacturing techniques have been optimised, turbine design has been largely concentrated on the three-bladed upwind model with variable speed and pitch regulation, and mass production and automation have resulted in economies of scale.
The general conclusion from industrial learning curve theory is that costs decrease by some 20 per cent each time the number of units produced doubles. A 20 per cent decline is equivalent to a progress ratio of 0.80.
In the calculation of cost reductions in this report, experience has been related to numbers of units, i.e. turbines, and not megawatt capacity. The increase in average unit size is therefore also taken into account. The progress ratio assumed here is at 0.90 up until 2009. After that it goes down to 0.80 before steadily rising again from 2016 onwards.
The reason for this graduated assumption, particularly in the early years, is that the manufacturing industry has not so far gained the full benefits of series production, especially due to the rapid upscaling of products. Neither has the full potential of future design optimisations been realised.
Contrary to this theory, the past few years, particularly since 2006, have seen a marked increase in the price of new wind turbines. This has been triggered by a mixture of rising raw material prices and shortages in the supply chain for turbine components. Examples of raw materials whose price has increased substantially are steel (used in towers, gearboxes and rotors), copper (used in generators) and concrete (used in foundations and towers). Global steel prices have almost doubled in the current year up to August 2008, while copper prices have quadrupled in the last five years. In addition, rising energy prices have also driven up the cost of manufacturing and transporting wind turbines. Supply chain pressures have included in particular a shortage of gearboxes and of the range of bearings used throughout the manufacturing of turbines. These shortages are being addressed by the component manufacturers, who are building new production capacity and opening up new manufacturing bases, for example in China. Some observers predict that component supply may catch up with demand by 2010.
Even so, the cost of wind turbine generators has still fallen significantly overall, and the industry is recognised as having entered the ‘commercialisation phase’, as understood in learning curve theories.
Capital costs per kilowatt of installed capacity are taken as an average of €1300 in 2007, rising to €1450 in 2009. They are then assumed to fall steadily from 2010 onwards to about €1050. From 2020 the scenario assumes a levelling out of costs. All figures are given at 2007 prices.
Scenario Results
An analysis of the Global Wind Energy Outlook scenarios shows that a range of outcomes is possible for the global wind energy market. The outcomes differ according to the choice of demand-side options and the assumptions for growth rates on the wind power supply side.
REFERENCE SCENARIO
The reference scenario, which is derived from the IEA’s World Energy Outlook 2007, starts off with an assumed growth rate of 27 per cent for 2008, decreasing to 10 per cent by 2010, then falling to 4 per cent by 2030.
As a result, the scenario foresees cumulative global capacity reaching 139 GW, producing 304 TWh per year and covering 1.7 per cent of the world’s electricity demand by the end of this decade. By 2020, global capacity would stand at 352 GW, growing to almost 500 GW by 2030, with an annual capacity increase of around 30 GW.
The relative penetration of wind energy into the global electricity supply system varies according to which demand projection is considered. Around 864 TWh produced in 2020 would account for between 3.6 per cent and 4.1 per cent of the world’s electricity production, depending on the extent of the energy-efficiency measures introduced. By 2030, production of 1218 TWh would only meet 4.2–5.1 per cent of global demand.
Figure 6.1. Regional Distribution – Reference Scenario, 2020 and 2030
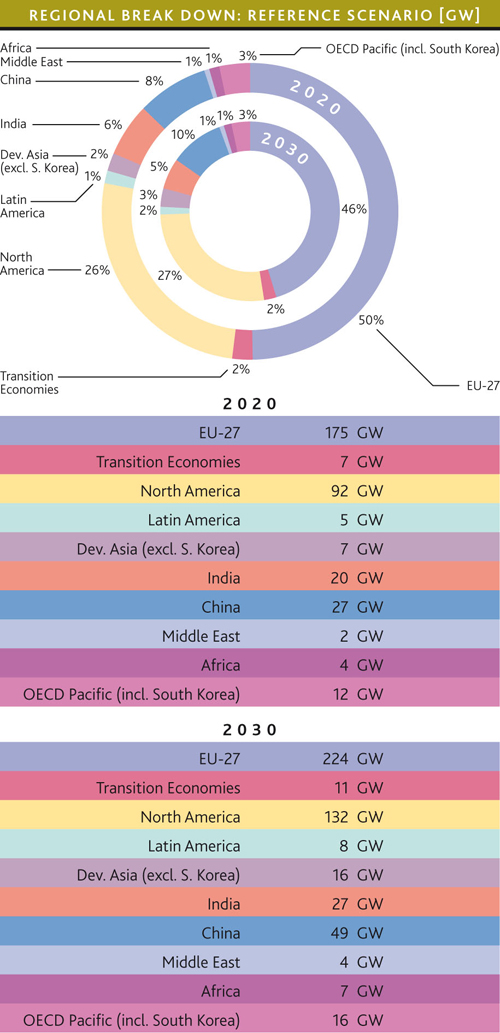
Source: GWEC
MODERATE SCENARIO
In the moderate wind energy scenario, growth rates are expected to be substantially higher than in the reference version. The assumed cumulative annual growth rate starts at 27 per cent for 2008, decreases to 19 per cent by 2010, and continues to fall gradually to 11 per cent by 2020 and 3 per cent by 2030.
The result is that by the end of this decade, the global wind power capacity is expected to reach 172 GW, with annual additions of 28.9 GW. By 2020, the annual market grows to 81.5 GW, and the cumulative global wind power capacity reaches a level of over 700 GW. By 2030, a total of over 1420 MW would be installed, with annual installations in the region of 84 GW.
In terms of generated electricity, this would translate into over 1700 TWh produced by wind energy in 2020 and 3500 TWh in 2030. Depending on demandside development, this would supply 7.3–8.2 per cent of global electricity demand in 2020 and 11.9–14.6 per cent in 2030.
Figure 6.2: Regional Distribution – Moderate Scenario, 2020 and 2030
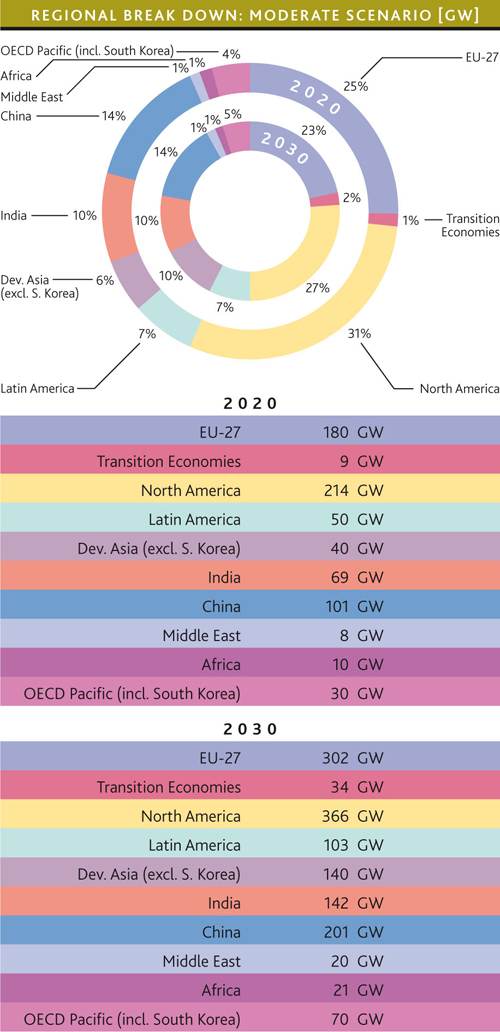
Source: GWEC
ADVANCED SCENARIO
In the advanced wind energy scenario, an even more rapid expansion of the global wind power market is envisaged. The assumed growth rate starts at 27 per cent in 2008, falls to 22 per cent by 2010, then to 12 per cent by 2020 and 5 per cent by 2030.
The result is that by the end of this decade, global capacity reaches 186 GW, with annual additions of around 36.5 GW. By 2020, global capacity is over 1000 GW, with annual additions of around 142 GW, and by 2030, the total wind generation capacity reaches almost 2400 GW. The annual market then stabilises at around 165 GW.
In terms of generated electricity, this translates into 2600 TWh produced by wind energy in 2020 and 5700 TWh in 2030. Again depending on the increase in demand by that time, wind power would cover 11.2– 12.6 per cent of global electricity demand in 2020 and as much as 19.7–24.0 per cent in 2030 – in other words meeting between a fifth and a quarter of the world’s electricity needs.
Figure 6.3: Regional Distribution – Advanced Scenario 2020 and 2030
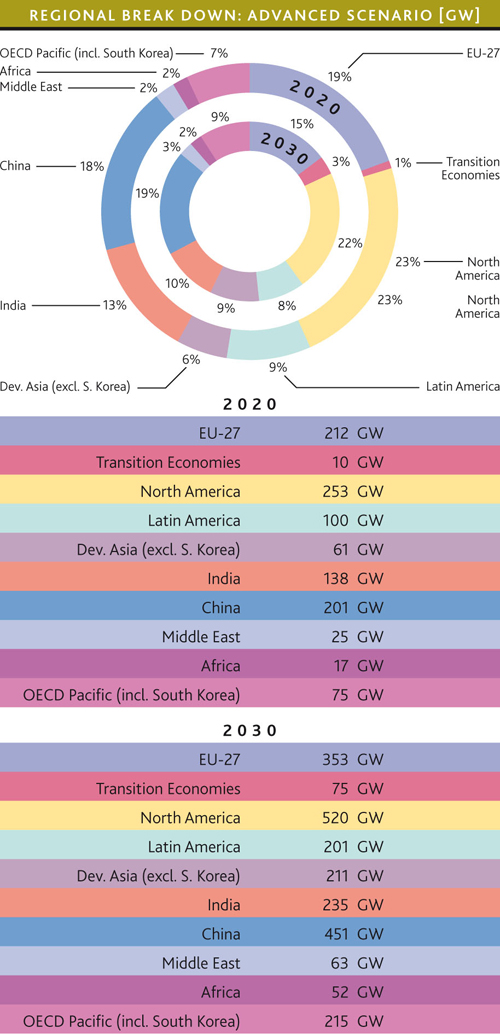
Source: GWEC
REGIONAL BREAKDOWN
All three scenarios for wind power are broken down into geographical regions based on the methodology used by the IEA. For the purposes of this analysis, the regions are defined as Europe, the transition economies, North America, Latin America, China, India, the Pacific (including Australia, South Korea and Japan), developing Asia (the rest of Asia), and the Middle East and Africa.
This breakdown of world regions has been used by the IEA in the ongoing series of World Energy Outlook publications. We chose to use it here in order to facilitate comparison with the IEA projections and because the IEA provides the most comprehensive global energy statistics.
The level of wind power capacity expected to be installed in each region of the world by 2020 and 2030 is shown in Figures 6.1 to 6.3. These show that Europe would continue to dominate the world market under the least ambitious reference scenario. By 2030, Europe would still have 46 per cent of the global wind power market, followed by North America with 27 per cent. The next largest region would be China with 10 per cent.
The two more ambitious scenarios envisage much stronger growth in regions outside Europe. Under the moderate scenario, Europe’s share will be 23 per cent by 2030, with North America dominating the global market at 27 per cent and major contributions coming from China (14 per cent), India (10 per cent) and developing Asia (10 per cent). Latin America (7 per cent) and the Pacific region (5 per cent) will play a smaller role than previously estimated.
The advanced scenario predicts an even stronger growth for China, which would see its share of the world market increasing to 19 per cent by 2030. The North American market accounts for 22 per cent of global wind power capacity, whilst Europe’s share is 15 per cent, followed by India (10 per cent), developing Asia (9 per cent), the Pacific region (9 per cent) and Latin America (8 per cent). In both scenarios, Africa and the Middle East would play only a minor role in the timeframe discussed (1 per cent of global capacity in the moderate and 2 per cent in the advanced scenario).
In all three scenarios it is assumed that an increasing share of new capacity is accounted for by the replacement of old power plants. This is based on a wind turbine average lifetime of 20 years. Turbines replaced within the timescale of the scenarios are assumed to be of the same cumulative installed capacity as the original smaller models. The result is that an increasing proportion of the annual level of installed capacity will come from repowered turbines. These new machines will contribute to the overall level of investment, manufacturing output and employment. As replacement turbines, their introduction will not, however, increase the total figure for global cumulative capacity.
The German Aerospace Centre
The German Aerospace Centre (DLR) is the largest engineering research organisation in Germany. Among its specialities are the development of solar thermal power station technologies, the utilisation of low- and high-temperature fuel cells, particularly for electricity generation, and research into the development of high efficiency gas and steam turbine power plants.
The Institute of Technical Thermodynamics at the DLR (DLR-ITT) is active in the field of renewable energy research and technology development for efficient and low-emission energy conversion and utilisation. Working in cooperation with other DLR institutes, industry and universities, research is focused on solving key problems in electrochemical energy technology and solar energy conversion. This encompasses application orientated research, the development of laboratory and prototype models, and the design and operation of demonstration plants. System analysis and technology assessment are used to help prepare strategic decisions in the field of research and energy policy.
Within the DLR-ITT, the System Analysis and Technology Assessment Division has long-term experience in the assessment of renewable energy technologies. Its main research activities are in the field of techno-economic utilisation and system analysis, leading to the development of strategies for the market introduction and dissemination of new technologies, mainly in the energy and transport sectors.
Scenario Background
The DLR was commissioned by Greenpeace International and EREC to conduct a study on global sustainable energy pathways up to 2050. This so-called ‘Energy revolution’ scenario published in early 2007 is a blueprint on how to cut global CO2 emissions by 50 per cent by 2050, while maintaining global economic growth. Part of the study examines the future potential for renewable energy sources; together with input from the wind energy industry and analysis of regional projections for wind power around the world, it forms the basis of the Global Wind Energy Outlook scenario.
| Acknowledgements | Sitemap | Partners | Disclaimer | Contact | ||
|
coordinated by |
supported by  |
The sole responsibility for the content of this webpage lies with the authors. It does not necessarily reflect the opinion of the European Communities. The European Commission is not responsible for any use that maybe made of the information contained therein. |
