MAIN PUBLICATION :
| Home � SCENARIOS & TARGETS � Contribution of wind power... � Chapter 3: Contribution of wind power to electricity generation and generation capacity in the EU-27 |

|
CHAPTER 3: CONTRIBUTION OF WIND POWER TO ELECTRICITY GENERATION AND GENERATION CAPACITY IN THE EU-27
Contribution of Wind Power to Electricity Generation
European electricity generation is projected to increase at an average annual rate of 1.8 per cent between 2000 and 2010, 1.3 per cent in the decade 2010– 2020, and 0.8 per cent in the decade up to 2030. If the reference scenario is reached, wind power production will increase to 177 TWh in 2010, 477 TWh in 2020 and 935 TWh in 2030. The European Commission’s baseline scenario assumes an increase in electricity demand of 33 per cent between 2005 and 2030 (4408 TWh). Assuming that EU electricity demand develops as projected by the European Commission, wind power’s share of EU electricity consumption will reach 5 per cent in 2010, 11.7 per cent in 2020 and 21.2 per cent in 2030.
If political ambitions to increase energy efficiency are fulfilled, wind power’s share of future electricity demand will be greater than the baseline scenario. In 2006, the European Commission released new scenarios to 2030 on energy efficiency and renewables. If EU electricity demand develops as projected in the European Commission’s ‘combined high renewables and efficiency’ (RE & Eff) case, wind energy’s share of electricity demand will reach 5.2 per cent in 2010, 14.3 per cent in 2020 and 28.2 per cent in 2030.
Table 3.1: Wind Power’s Share of EU Electricity Demand
| Wind power’s share of EU electricity demand | |||||
| 2000 | 2007 | 2010 | 2020 | 2030 | |
| Wind power production (TWh) | 23 | 119 | 177 | 477 | 935 |
| Reference electricity demand (TWh) | 2,577 | 3,243 | 3,568 | 4,078 | 4,408 |
| RE Eff. case electricity demand (TWh) |
2,577 | 3,243 | 3,383 | 3,345 | 3,322 |
| Wind energy share (reference) | 0.9 | 3.7 | 5.0 | 11.7 | 21.2 |
| Wind energy share (RE Eff. case) | 0.9 | 3.7 | 5.2 | 14.3 | 28.2 |
Source: Eurelectric, EWEA and European Commission
Figure 3.1: Wind Power’s Share of EU Electricity Demand
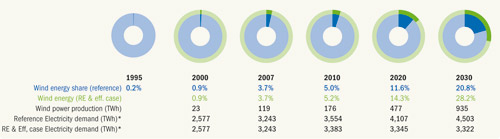
Source: EWEA (2008a)
Contribution of Wind Power to Generation Capacity
The IEA expects 5087 GW of electricity generating capacity to be installed worldwide in the period 2005–2030, requiring investments of US$5.2 trillion in power generation, $1.8 trillion in transmission grids and $4.2 trillion in distribution grids. The IEA expects 862 GW of this total to be built in the EU, requiring investments of $925 billion in new generation, $137 billion in transmission and $429 billion in distribution grids.
As already mentioned, wind power’s contribution to new power capacity in the EU was exceeded only by gas in the last eight years. 30 per cent of all installed capacity in the period 2000 to 2007 was wind power, 55 per cent was natural gas and 6 per cent was coal-based.
Spare electricity generating capacity is at a historic low and phase-out policies in the EU Member States require 27 GW of nuclear plants to be retired. Europe has to invest in new capacity to replace ageing plants and meet future demand. Between 2005 and 2030, a total of 862 GW of new generating capacity needs to be built, according to the IEA – 414 GW to replace ageing power plants and an additional 448 GW to meet the growing power demand. The capacity required exceeds the total capacity operating in Europe in 2005 (744 GW).
The IEA is less optimistic about the development of wind energy than EWEA. Hence, it is necessary to adjust the IEA figures for total generating capacity and new capacity to take account of the fact that wind energy’s capacity factor is lower than that of the average coal, gas or oil plant. Adjusting for the capacity factor adds 18 GW to total generating capacity in 2030 to make a total of 1,176 GW, and 26 GW to the figure for new generating capacity between 2005 and 2030 to make a total of 889 GW over the period. In 2005, 5.4 per cent of all electricity generating capacity in the EU was wind energy. That share is forecast to increase to 9.9 per cent in 2010, 18.1 per cent in 2020 and 25.5 per cent in 2030. Wind power’s share of new generating capacity is forecast to be 34 per cent in the period 2005–2020 and 46 per cent in the decade up to 2030. Wind power’s share of new capacity in Europe in the 25-year period 2005–2030 should be 39 per cent.
Table 3.2: Wind Power’s Share of Installed Capacity
| 2005 | 2010 | 2020 | 2030 | |
| Total installed capacity (GW) | 744 | 811 | 997 | 1,176 |
| Total installed wind capacity (GW) | 40 | 80 | 180 | 300 |
| Wind power's share of installed capacity | 5.4 | 9.9 | 18.1 | 25.5 |
Figure 3.2: Wind Power’s Share of Installed Capacity
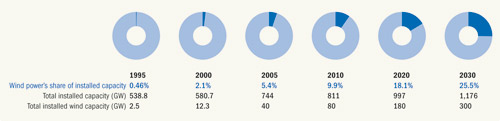
Source: EWEA (2008a)
Table 3.3: Wind Power’s Share of New Capacity
| 2005-2010 | 2011-2020 | 2021-2030 | |
| New generating capacity (GW) | 117 | 368 | 404 |
| New wind generating capacity (GW) | 46 | 117 | 187 |
| Wind power's share of new capacity | 39 | 32 | 46 |
Figure 3.3: Wind Power’s Share of New Capacity
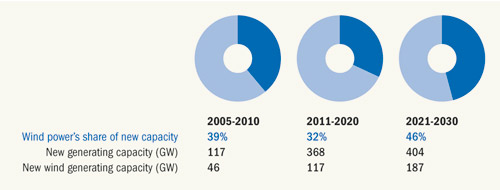
Source: EWEA (2008a)
BASELINE SCENARIOS
Both the European Commission and the International Energy Agency (IEA) publish baseline scenarios for the development of various electricity-generating technologies, including wind energy. In 1996, the European Commission estimated that 8000 MW would be installed by 2010 in the EU. The 8000 MW target was reached in 1999. The Commission’s target for 2020 was set at 12,300 MW and reached, two decades ahead of schedule, in 2000.
Since 1996, the European Commission has changed its baseline scenario five times. Over the 12-year period, targets for wind energy in 2010 and 2020 have been increased almost tenfold, from 8 GW to 71 GW (2010) and from 12 GW to 120 GW (2020) in the European Commission’s latest baseline scenario from 2008. Surprisingly, the baseline scenario from 2008 gives significantly lower figures for wind energy than the baseline scenario from 2006. The 71 GW projection for 2010 implies that the wind energy market in Europe will decrease by approximately 50 per cent over the next three years with respect to the present market. In the light of the current market achievements, growth trends and independent market analyses, the European Commission’s baseline scenario seems completely out of touch with the market reality, and clearly underestimates the sector’s prospects.
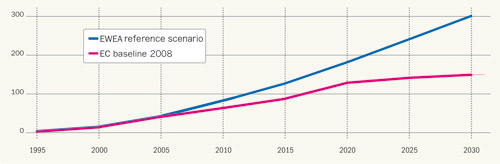
Figure 3.4 shows the forecast for average annual installations (GW) up to 2030 according to the European Commission’s 2008 baseline scenario and to EWEA’s baseline, or ‘reference’, scenario compared with the 2007 market level.
Figure 3.4: European Commission Baseline Scenario Compared with Actual Market and EWEA Target
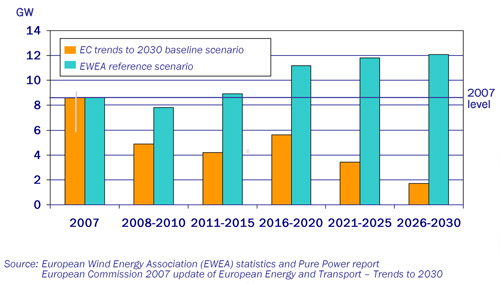
Historically, EWEA’s scenarios have been somewhat conservative, and its targets have been revised upwards numerous times. EWEA’s 2010 target (based on its ‘reference’ scenario) was doubled from 40 GW (in 1997) to 80 GW (in 2006). The EWEA reference scenario for 2020 is 60 GW higher than the Commission’s baseline scenario. For 2030, the Commission assumes 146 GW while EWEA assumes 300 GW.
Table 3.4 shows the European Commission’s various scenarios for wind energy installations up to 2030, compared with the actual market up to 2008 and EWEA’s 2007 scenario up to 2030.
Table 3.4: European Commission Scenarios Compared with Actual Market, EWEA 2008 Reference Scenario
| 1995 | 2000 | 2005 | 2010 | 2015 | 2020 | 2025 | 2030 | |
| EC 1996 | 4.4 | 6.1 | 8.0 | 10.1 | 12.3 | |||
| EC 1999 | 15.3 | 22.6 | 47.2 | |||||
| EC 2003 | 69.9 | 94.8 | 120.2 | |||||
| EC 2004 | 2.5 | 12.8 | 72.7 | 103.5 | 134.9 | |||
| EC 2006 | 12.8 | 37.7 | 78.8 | 104.1 | 129.0 | 165.8 | 184.5 | |
| EC 2008 reference scenario | 40.8 | 71.3 | 92.2 | 120.4 | 137.2 | 145.9 | ||
| Actual market / EWEA 2007 target | 2.497 | 12.887 | 40.5 | 80.0 | 124.5 | 180.0 | 239.3 | 300.0 |
Fig 3.5: European Commission’s 2008 Baseline Scenario Compared with the EWEA Target up to 2030 (in GW)
Source: EWEA (2008a)
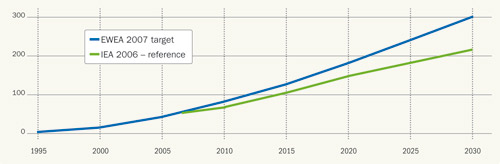
The IEA also produces baseline scenarios for the development of wind power. In 2002, the Agency estimated that 33 GW would be installed in Europe in 2010, 57 GW by 2020 and 71 GW by 2030. Two years later, in 2004, it doubled its forecast for wind energy to 66 GW in 2010, and more than doubled its 2020 and 2030 business-as-usual scenarios for wind in the EU to 131 GW in 2020 and 170 GW in 2030. In 2006, the IEA again increased its 2030 target for wind power in the EU to 217 GW (its alternative policy scenario assumes 227 GW). The IEA’s reference scenario assumes 68 GW in 2010, 106 GW in 2015, 150 GW in 2020 and 217 GW in 2030. EWEA’s reference scenario assumes 80 GW in 2010, 125 GW in 2015, 180 GW in 2020 and 300 GW in 2030.
The European Commission’s baseline scenario claims to take ‘into account the high energy import price environment’, by assuming an oil price of US$55/ barrel in 2005, $44.6/barrel in 2010 and $62.8/barrel in 2030. In its 2006 scenario, the IEA assumes an oil price of $47 in 2015, reaching $55 in 2030. In July 2008, the crude oil prices reached an all-time high of $147 a barrel. At the time of writing, there are indications that the IEA will increase its oil price forecast for 2020 to the $100–$120 range.
Table VI.3.5 shows the IEA’s various scenarios for wind energy installations in Europe up to 2030, compared with the actual market up to 2007, followed by EWEA’s 2008 scenario up to 2030. Figure 3.6 shows the IEA’s 2006 reference scenario compared with the EWEA target up to 2030.
Table 3.5: IEA’s Scenarios up to 2030 Compared with Actual Market/EWEA 2007 target
| IEA`s scenarios for wind energy installations up to 2030, compared with the actual market/EWEA 2007 scenario | ||||||||
| 1995 | 2000 | 2005 | 2010 | 2015 | 2020 | 2025 | 2030 | |
| IEA 2002 | 33.0 | 57.0 | 71.0 | |||||
| IEA 2004 | 66.0 | 131.0 | 170.0 | |||||
| IEA 2006 - reference | 68.0 | 106.0 | 150.0 | 217.0 | ||||
| IEA 2006 - APS* | 71.0 | 108.0 | 151.0 | 223.0 | ||||
| Actual market/EWEA 2007 scenario | 2.5 | 12.9 | 40.5 | 80.0 | 124.5 | 180.0 | 239.3 | 300.0 |
| *alternative policy scenario |
Fig 3.6: IEA’s 2006 Baseline Scenario Compared with the EWEA Target up to 2030 (in GW)
Source: EWEA (2008a)
Table 3.6 shows EWEA’s various scenarios for wind energy installations up to 2030, compared with the actual market up to 2007.
Table 3.6: EWEA’s Scenarios up to 2030 Compared with the Actual Market/EWEA 2007 Target
| 1995 | 2000 | 2005 | 2010 | 2015 | 2020 | 2025 | 2030 | |
| EWEA 1997 | 40 | |||||||
| EWEA 2000 | 60 | 150 | ||||||
| EWEA 2003 | 75 | 180 | ||||||
| Actual Market/ EWEA target | 2.5 | 12.9 | 40.5 | 80 | 125 | 180 | 165 | 300 |
In its World Energy Outlook 2006, the IEA adopts a rather pessimistic view towards future wind energy installations around the globe, particularly as far as the US and the Chinese markets are concerned. Table 3.7 shows that a yearly averaging out of the installations required to reach the IEA 2015 cumulative target results in installation figures significantly below current market levels. At the time of writing, the IEA’s World Energy Outlook 2008 has not been published, but there are indications that the Agency’s forecast for global wind energy development will be increased to better reflect market expectations.
Table 3.7: Source GWEC 2007 Statistics, IEA 2006 World Energy Outlook
| 2007 cumulative (GWEC) | 2015 cumulative (IEA) | 2007 annual (GWEC) | Average/year 2008-2015 IEA | |
| World | 93.9 | 168 | 19.9 | 9.2 |
| OECD North America | 18.7 | 30 | 5.6 | 1.4 |
| European Union | 56.5 | 106 | 8.5 | 6.2 |
| China | 5.9 | 7 | 2.6 | 0.1 |
Sources: GWEC (2008) and IEA World Energy Outlook
ADVANCED SCENARIOS
In addition to the baseline/business-as-usual scenarios, the European Commission and the IEA have in recent years published more advanced scenarios with less static assumptions. The European Commission’s new scenarios on energy efficiency and renewables from 2006 assume that ‘agreed policies will be vigorously implemented in the Member States and that certain new targets on the overall share of renewables in 2020 will be broadly achieved’. However, the underlying estimates of fuel and carbon prices are no different from the baseline scenario.
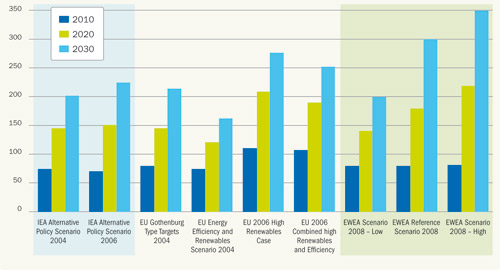
Both the European Commission’s and the IEA’s advanced scenarios from 2004 are in line with the 80 GW target in 2010 from EWEA. However, the 2020 and 2030 targets from the IEA and the European Commission are significantly below EWEA’s targets. The 2006 IEA alternative policy scenario for the EU (151 GW in 2020) is, somewhat surprisingly, only 1 GW higher than its reference scenario. Its 2030 alternative policy scenario is a mere 6 GW higher than its reference scenario (217 GW). The European Commission’s advanced 2006 scenarios are more in line with the EWEA targets, and even exceed EWEA’s targets for 2020.
Fig 3.7: Advanced Scenarios for 2010, 2020 and 2030 (in GW)
Source: EWEA (2008a)
| Acknowledgements | Sitemap | Partners | Disclaimer | Contact | ||
|
coordinated by |
supported by  |
The sole responsibility for the content of this webpage lies with the authors. It does not necessarily reflect the opinion of the European Communities. The European Commission is not responsible for any use that maybe made of the information contained therein. |
