MAIN PUBLICATION :
| Home � SCENARIOS & TARGETS � Projecting targets for the EU-27 � Chapter 2: Projecting targets for the EU-27 up to 2030 |

|
CHAPTER 2: PROJECTING TARGETS FOR THE EU-27 UP TO 2030
TARGETS FOR 2010
EWEA’s forecast for 2010 assumes that approximately 85GW of wind energy will be installed and grid-connected. The Danish wind energy consultancy, BTM consult is more optimistic than EWEA and foresees a cumulative installed capacity of 91.5 GW by the end of 2010. The main growth markets it highlights are Portugal, France and the UK.
Figure 2.1 Cumulative wind power installed in the European Union (in MW)
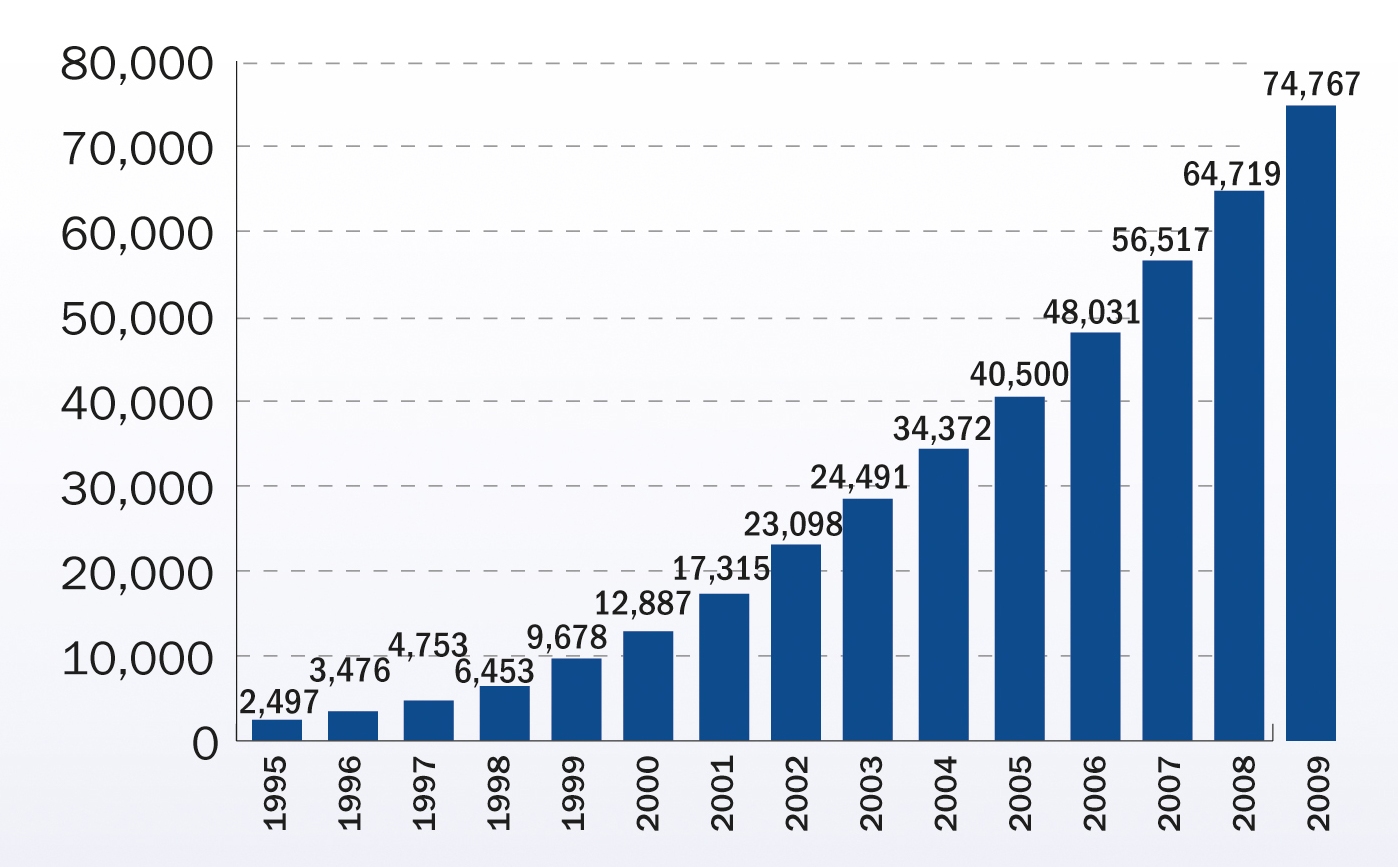
Source: EWEA (2010): Wind in Power, p.9
By the end of 2009, almost 2.8 per cent of wind capacity in the EU was in offshore installations, producing over 4 per cent of total wind power in Europe. In 2010, EWEA expects 4 per cent of total capacity and 13 per cent of the annual market to be covered by offshore wind. EU wind energy production will increase to 7 per cent by 2010.
The 74.8 GW of installed capacity in the EU-27 by the end of 2009 will, in a normal wind year, produce 163 TWh of electricity, enough to meet 4.8 per cent of EU electricity demand. The capacity installed by the end of 2010 will produce around 180 TWh in a normal wind year, equal to over 5 per cent of demand in 2010 (5.7 per cent of 2006 demand).
Germany is projected to reach almost 27 GW and Spain around 21 GW of wind capacity in 2010. France, the UK, Italy and Portugal constitute a second wave of stable markets and should install 42 per cent of new EU capacity in 2010.
2009 was a record year for wind power in Europe with almost 10.2 GW of installations. In 2010 a similar amount of installations as in the previous year are expected. The 2009 installations and the expected 2010 installations, including over 1GW of offshore equate to total investments of 27.2 billion euros.
In 2009, Germany and Spain’s share of the European annual market was 43 per cent. In 2010, it is expected to represent around 30 per cent, compared to 39 per cent in 2008 and 60 per cent in 2007 and 80 per cent in 2002, confirming a healthy trend towards less reliance on the first mover markets. The largest markets in 2010 are expected to be Germany (20 per cent), the UK (19 per cent) and France and Italy (11 per cent).
Figure 2.2 Germany and Spain’s share of the European annual market
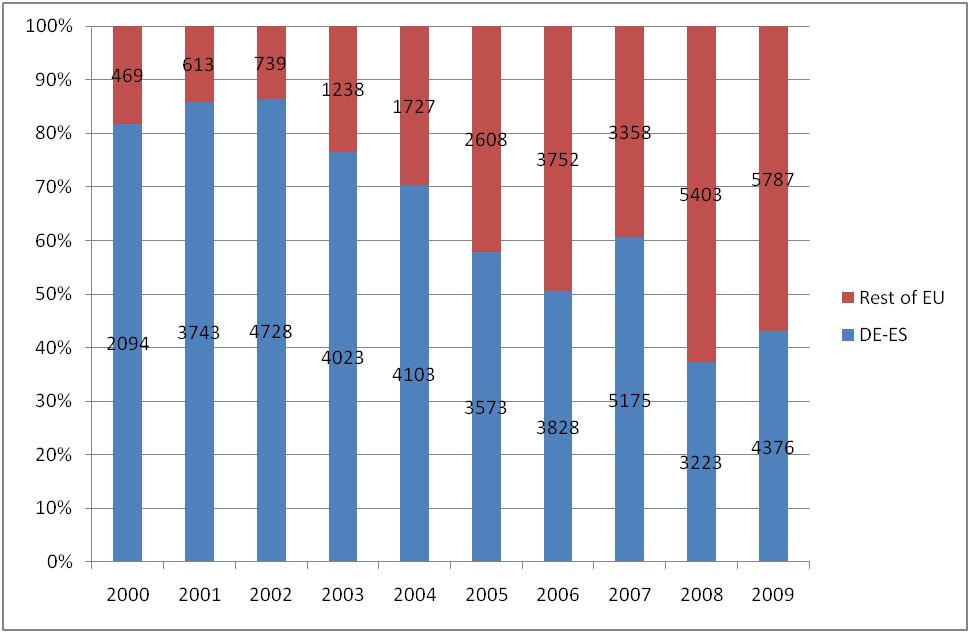
Source: EWEA
Figure 2.3 EU member state market shares for total installed capacity (2009) total 74.767 MW
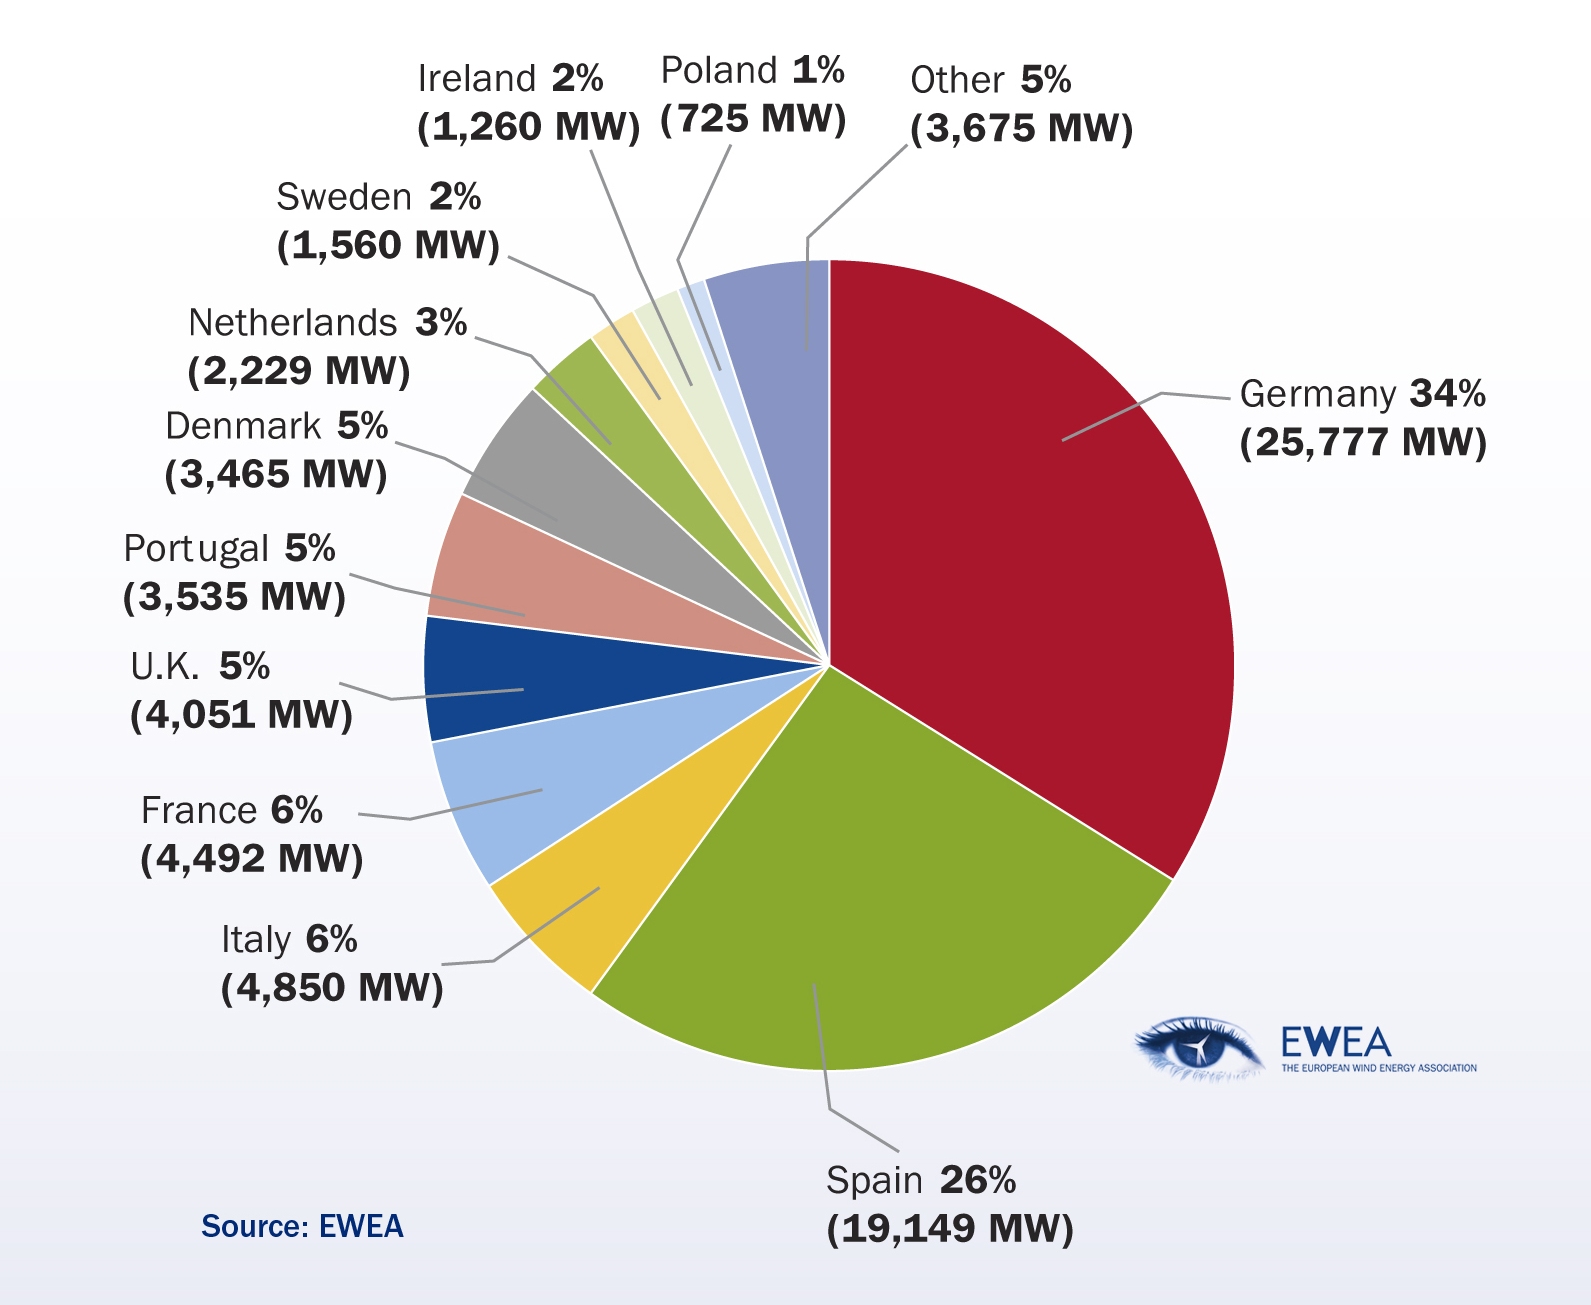
Source: EWEA (2010): Wind in Power, p. 9
TARGETS FOR 2020
On 9 March 2007, the European Heads of State agreed on a binding target of 20 per cent renewable energy by 2020. The 2005 share of renewable energy was approximately 7 per cent of primary energy and 8.5 per cent of final consumption. In January 2008, the European Commission proposed a new legal framework for renewables in the EU, including a distribution of the 20 per cent target between Member States and national action plans containing sectoral targets for electricity, heating and cooling, and transport.
To meet the 20 per cent target for renewable energy, the European Commission expects 34 per cent of electricity to come from renewable energy sources by 2020 and believes that ‘wind could contribute 12 per cent of EU electricity by 2020’.
Figure 2.4: EU member state market shares for new capacity installed during 2009, total 10,163 MW
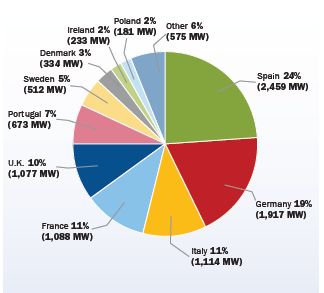
Source: EWEA (2010): Wind in power, p. 5
Figure 2.5: National Overall Targets for the Share of RES in Final Energy Consumption 2020
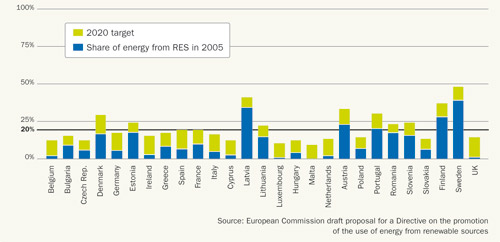
Source: European Commission draft proposal for a Directive on the promotion of the use of energy from renewable sources, EWEA (2008a)
In 2005 (the reference year of the proposed directive), approximately 15 per cent of EU electricity demand was covered by renewable, including around 10 per cent from large hydro and about 2.1 per cent from wind energy. In 2009, the share of wind energy had grown to over 4.8 per cent.
Excluding large hydropower, for which the realisable European potential has already been reached, and assuming that electricity demand does not increase, the share of renewable electricity in the EU will need to grow fivefold – from approximately 5 per cent to 25 per cent – to reach the electricity target.
With increased demand, renewable electricity other than large hydropower will need to grow even more.
In light of the rapid development of the wind energy market, in 2009 EWEA upped its 2020 target for the EU from 180 GW to 230 GW, including 40 GW offshore, in its low scenario and 265 GW, including 55 GW offshore in its high scenario. To meet the low scenario target, 155.3 GW, including 38 GW offshore, would have to be installed in the 11 year period from 2010 to 2020. Similarly, to meet the high scenario target, 190.3 GW, including, 53 GW offshore would have to be installed over the 11 years. Furthermore, 16.4 GW of capacity are expected to be replaced in the period.
The 230 GW would produce 580.1 TWh of electricity, whilst the high-scenario 265 GW would produce 681.4 TWh, equal, respectively to 14.2 per cent and 16.7 per cent of EU electricity consumption, contingent to the development in demand for power. Between twenty-five per cent and 29 per cent of the wind energy would be produced offshore in 2020.
Table 2.1: Targets for RES, Electricity from RES and Wind Energy for 2020
| 2005 (per cent) |
2020 (per cent) |
|
| Renewable energy sources (RES) | 8.5 | 20 |
| Electricity from RES | 15 | 34 |
| Wind Energy | 2.1 | 12-14 |
| Offshore Wind Energy |
0 | 3.2-4 |
Between 2011 and 2020, the annual onshore market for wind turbines will grow steadily from around 9.5 GW a year to 18 GW per year. The offshore market will increase from 1.5 GW in 2011 to reach 6.9 GW in 2020 in the low scenario. Throughout the period of this scenario, the onshore wind power market exceeds the offshore market in the EU.
Figure 2.6: Cumulative EU wind energy capacity (1990-2020)
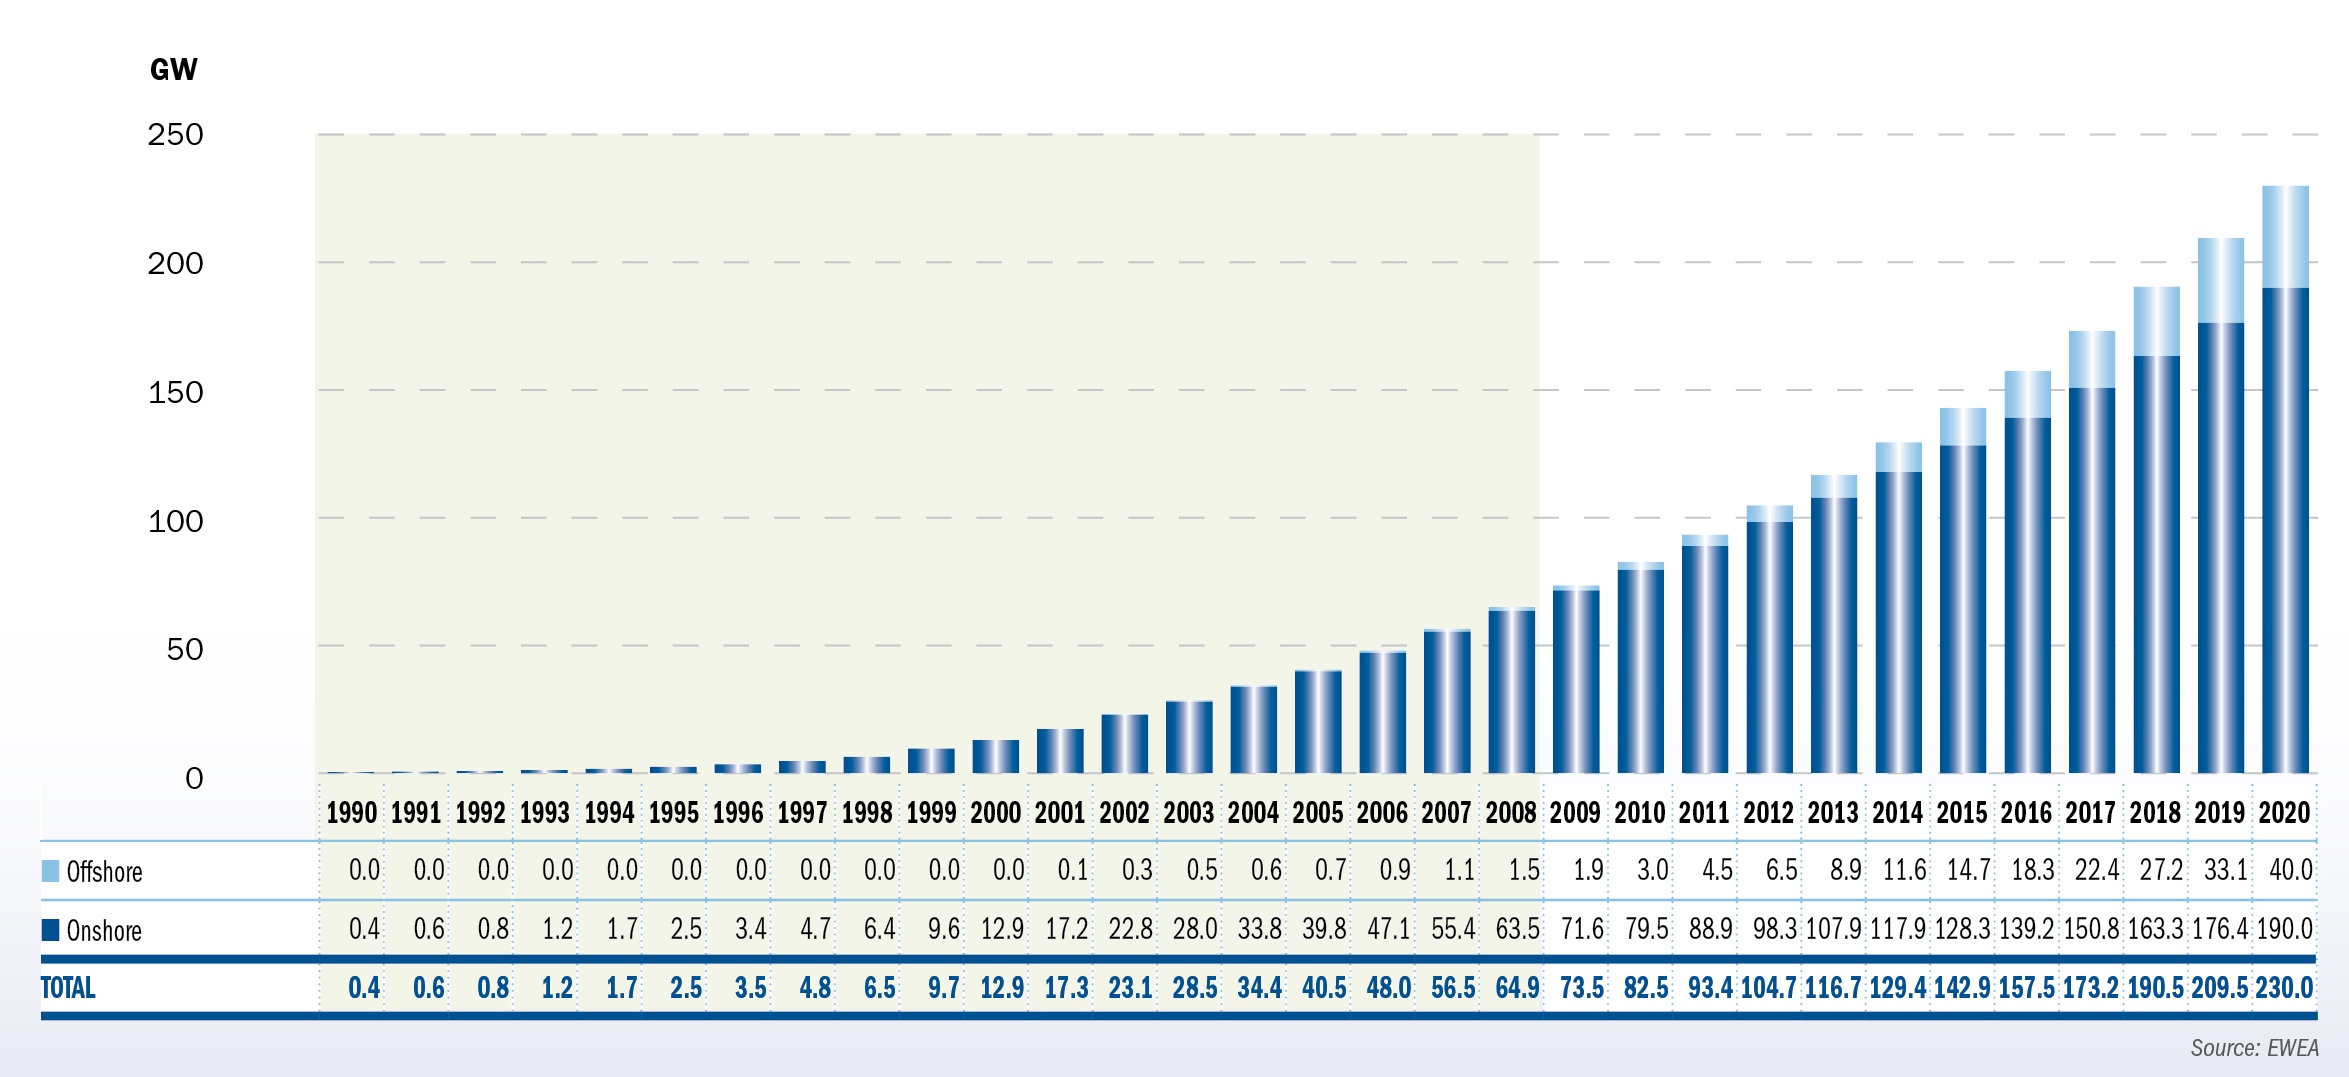
Data collected in February 2010 indicates that 2009 installations were 10.163 Mw in the EU, above the EWEA scenario developed in November 2009.
Source: EWEA (2009): Pure Power, p. 41
Figure 2.7: Wind power production in the EU (2000-2020)
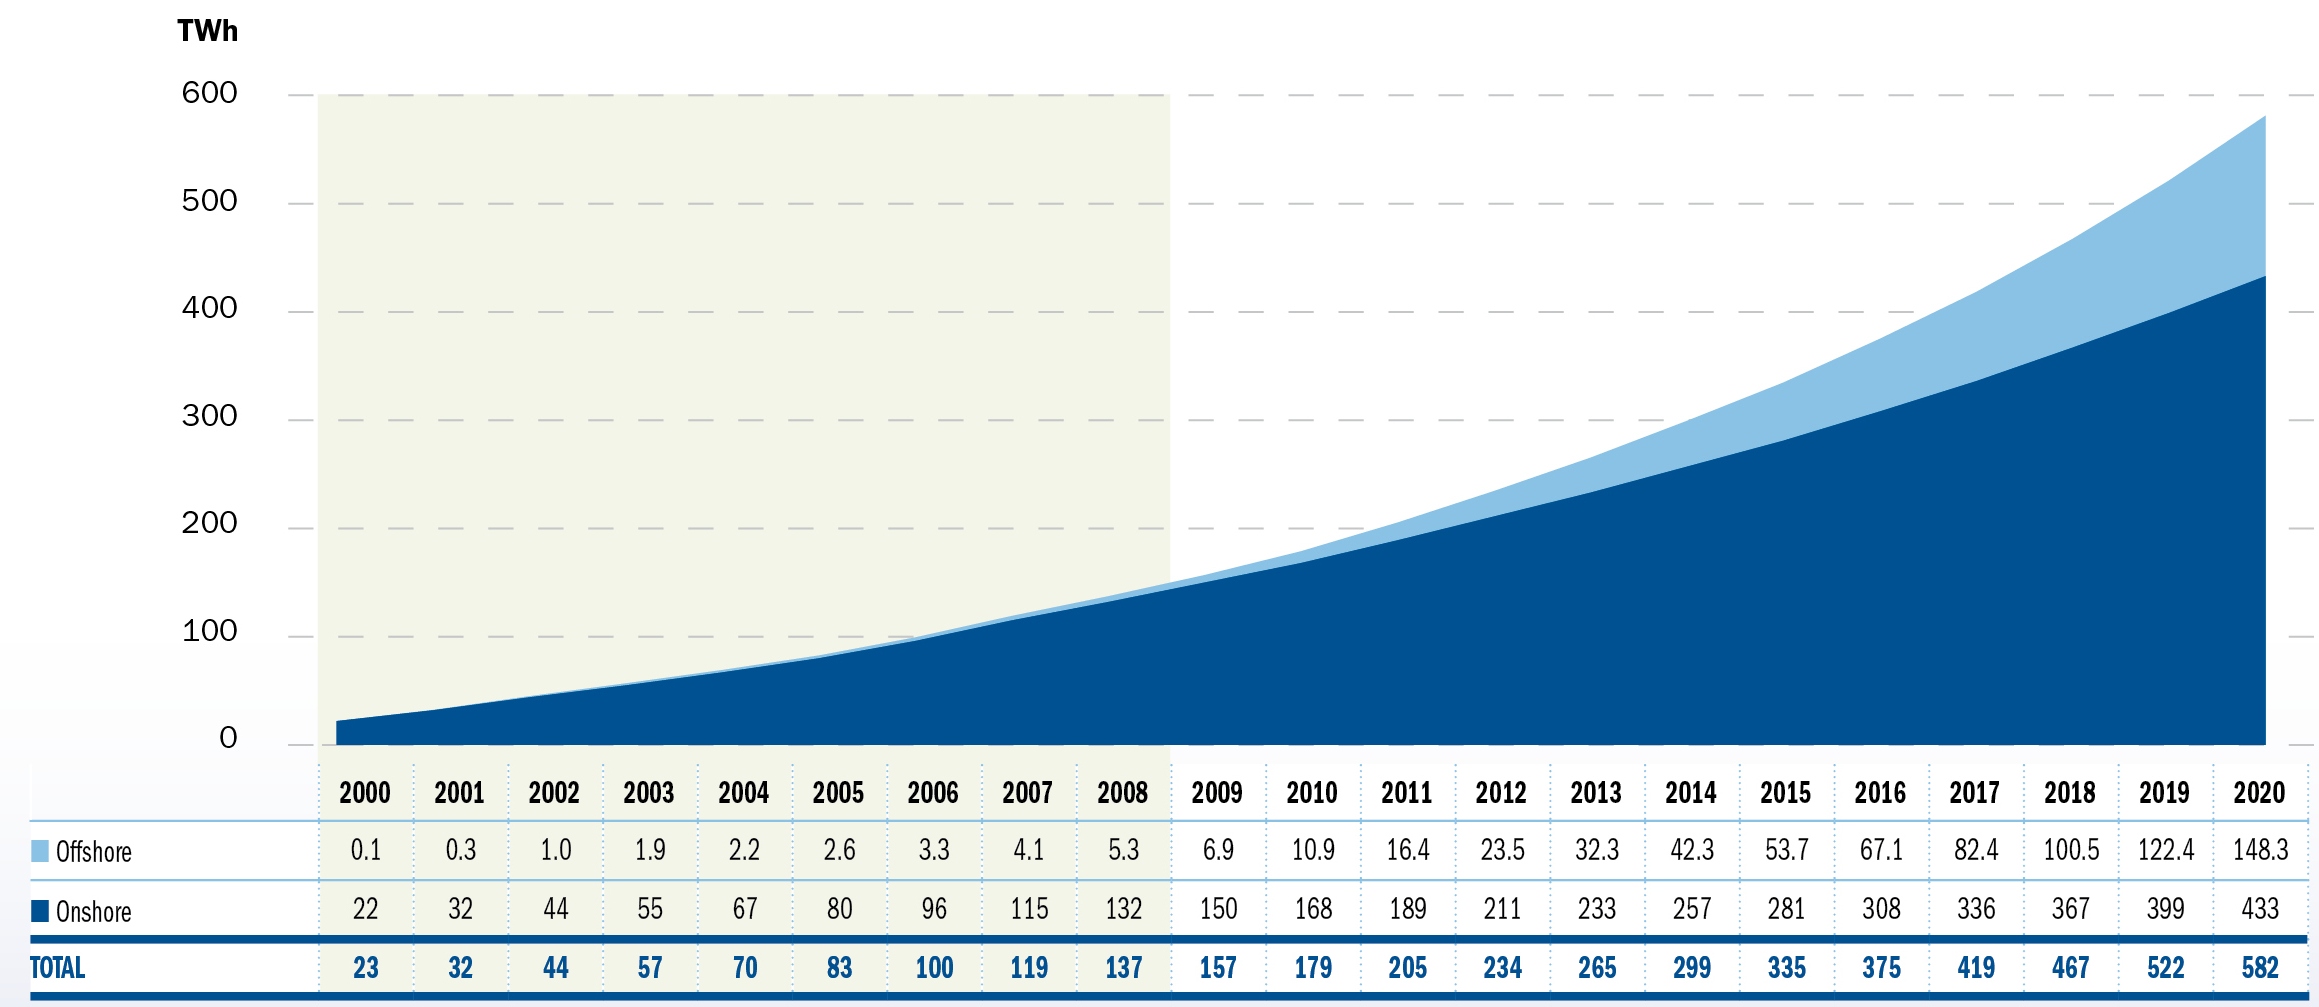
Source: EWEA (2009): Pure Power, p.41
Figure 2.8: New annual EU wind energy capacity (1991-2020)
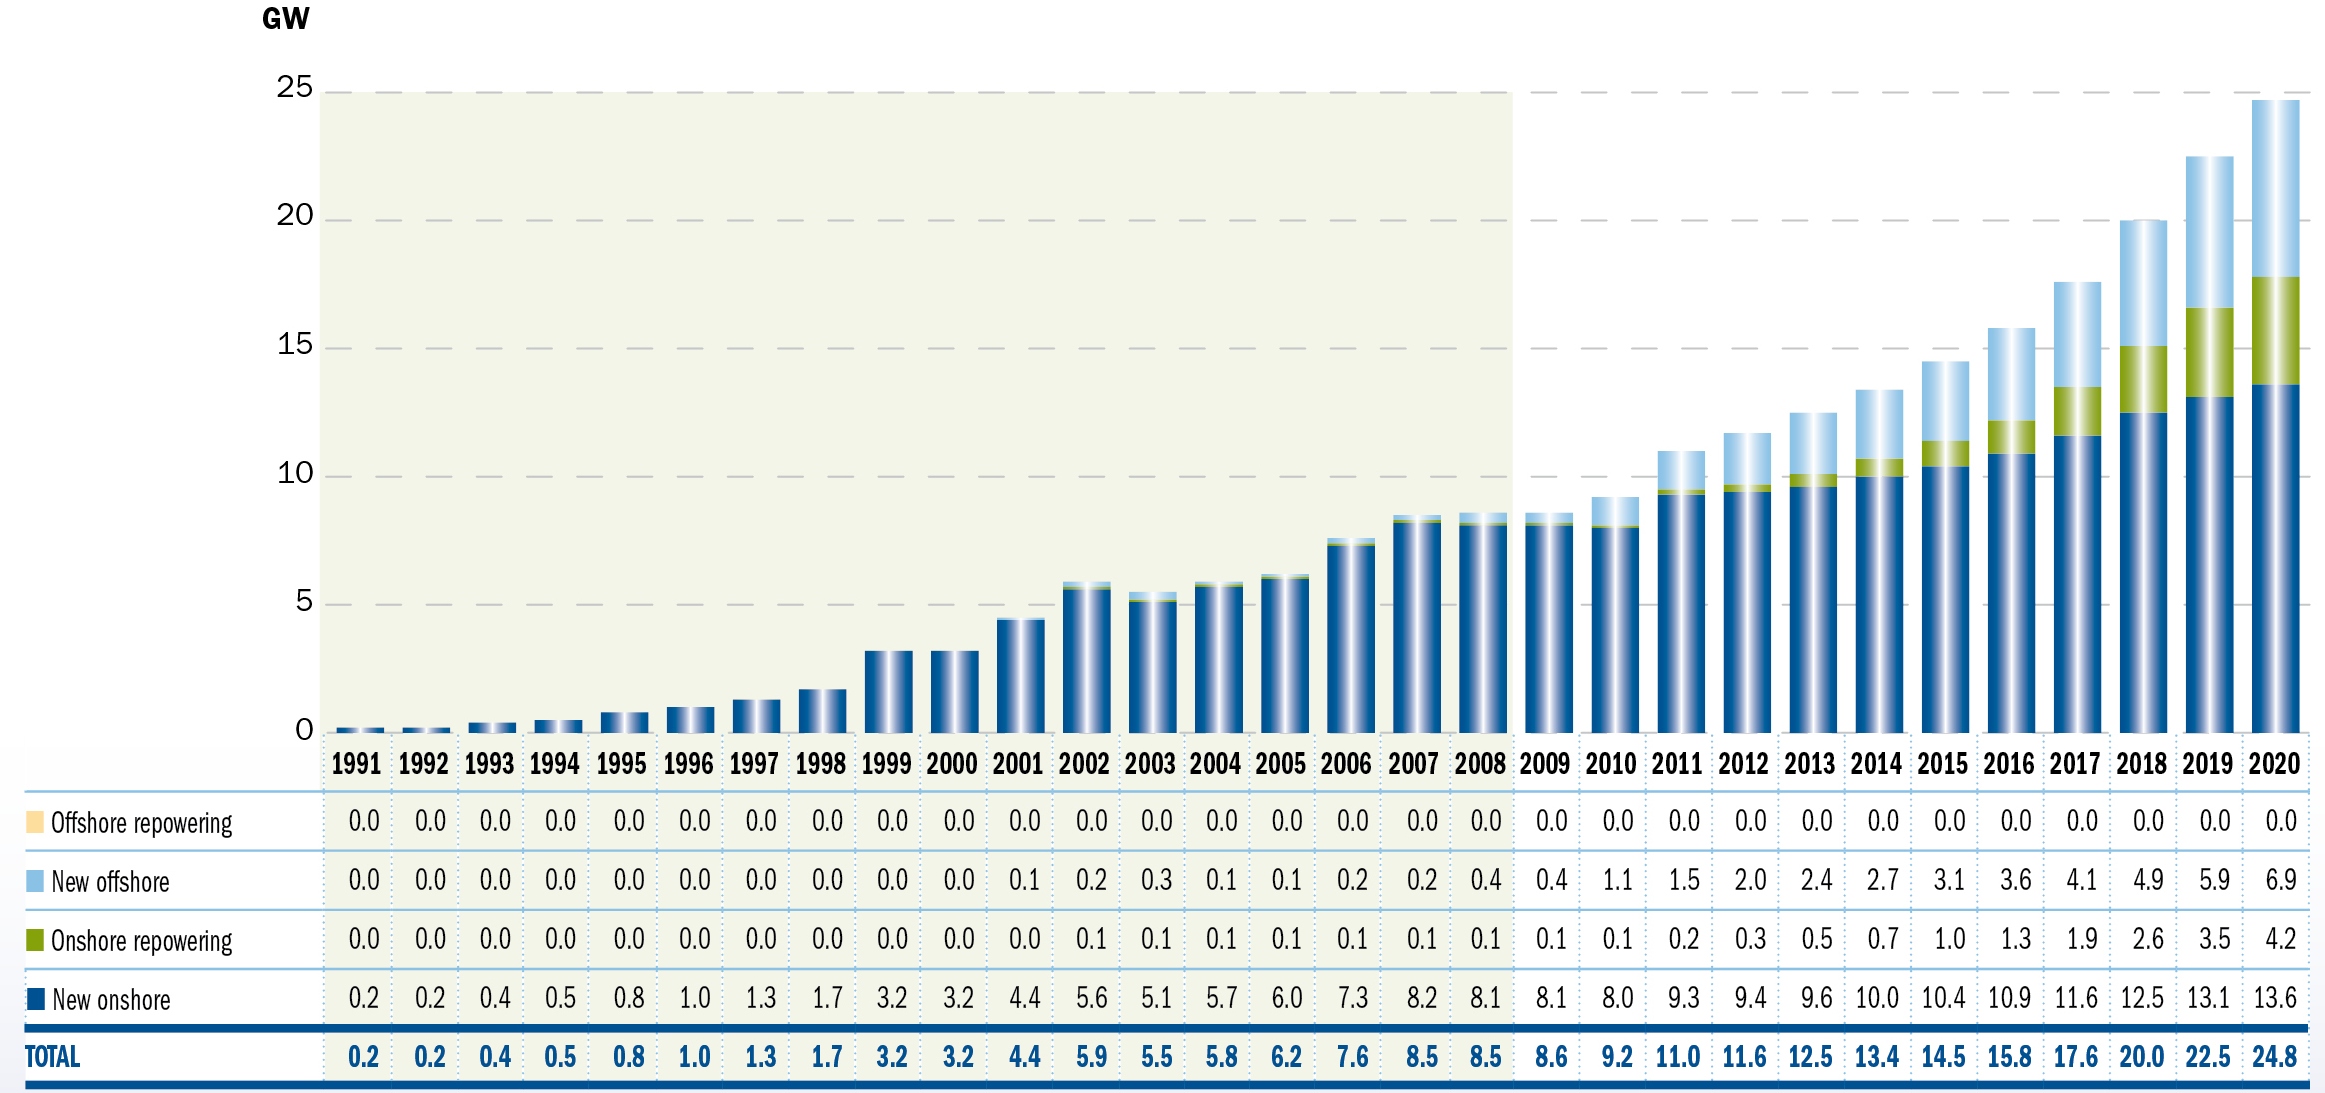
Data collected in February 2010 indicates that 2009 installations were 10.163 Mw in the EU, above the EWEA scenario developed in November 2009.
Source: EWEA (2009): Pure Power, p.40
TARGETS FOR 2030
In the EWEA scenario, 400 GW of wind power will be operating in the EU in 2030, including 150 GW (37.5 per cent) of offshore wind power.
Figure 2.9: Cumulative onshore and offshore wind in the EU (1990-2030)
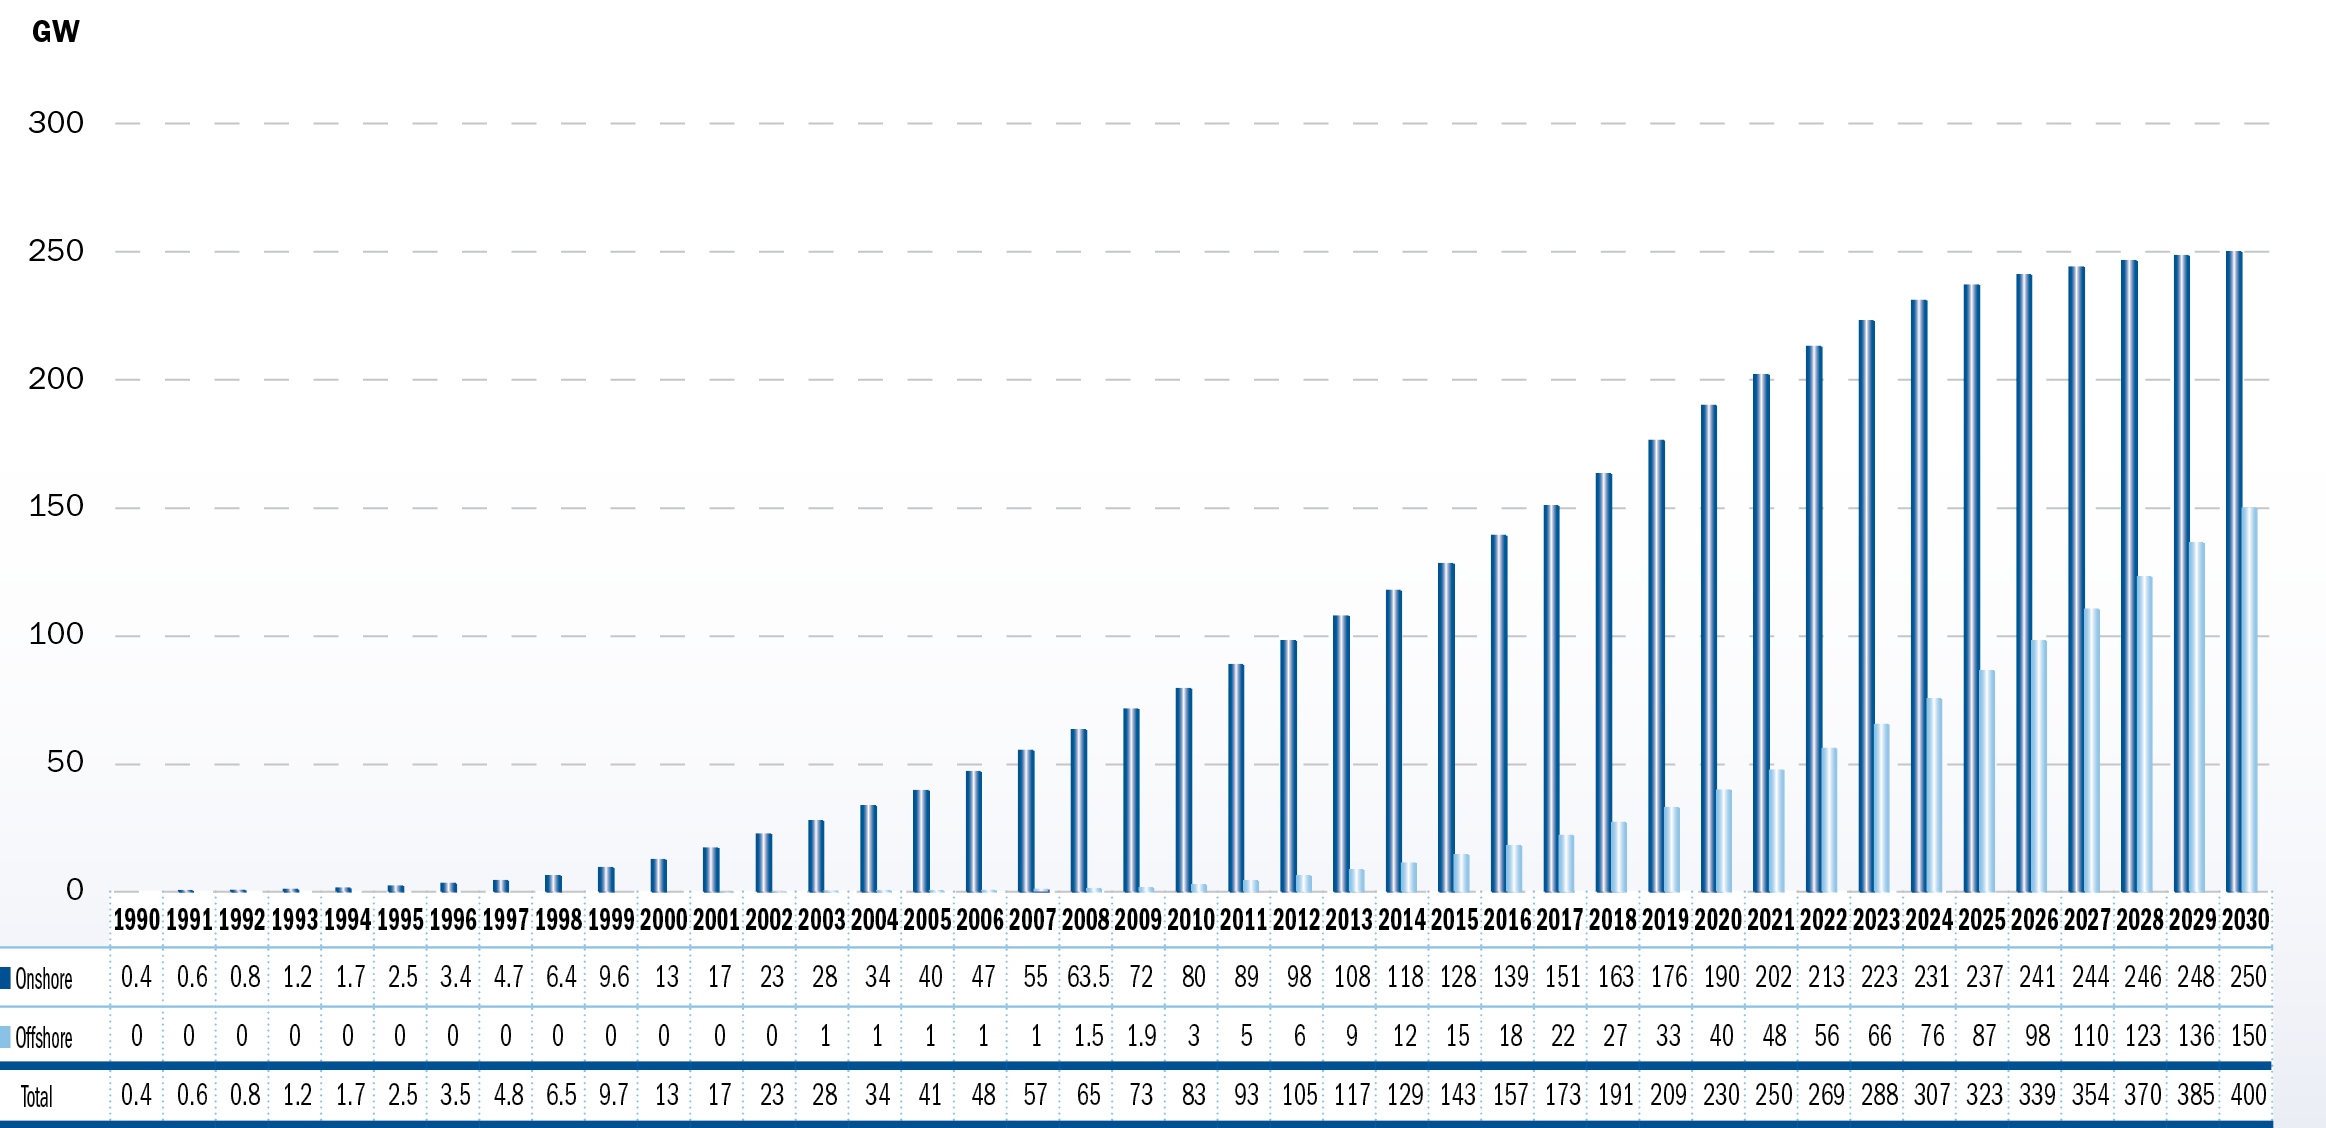
Data collected in February 2010 indicates that 2009 installations were 10.163 Mw in the EU, above the EWEA scenario developed in November 2009.
Source: EWEA (2009): Pure Power, p.45
In the decade from 2021 to 2030 242 GW will be installed. Of this, 71 GW will be needed to replace decommissioned capacity, predominantly onshore. Onshore will represent 54 per cent (131 GW) of the capacity installed during that decade and the onshore market will remain larger than the offshore market until 2026/2027 when annual offshore installations will become more important. By 2030, the annual onshore market will be 10.5 GW, of which 9 GW in replacement of decommissioned capacity and the offshore market will be 13.7 GW with only 0.1 GW replacing decommissioned capacity.
Figure 2.10: Annual wind power installations EU (2000-2030)
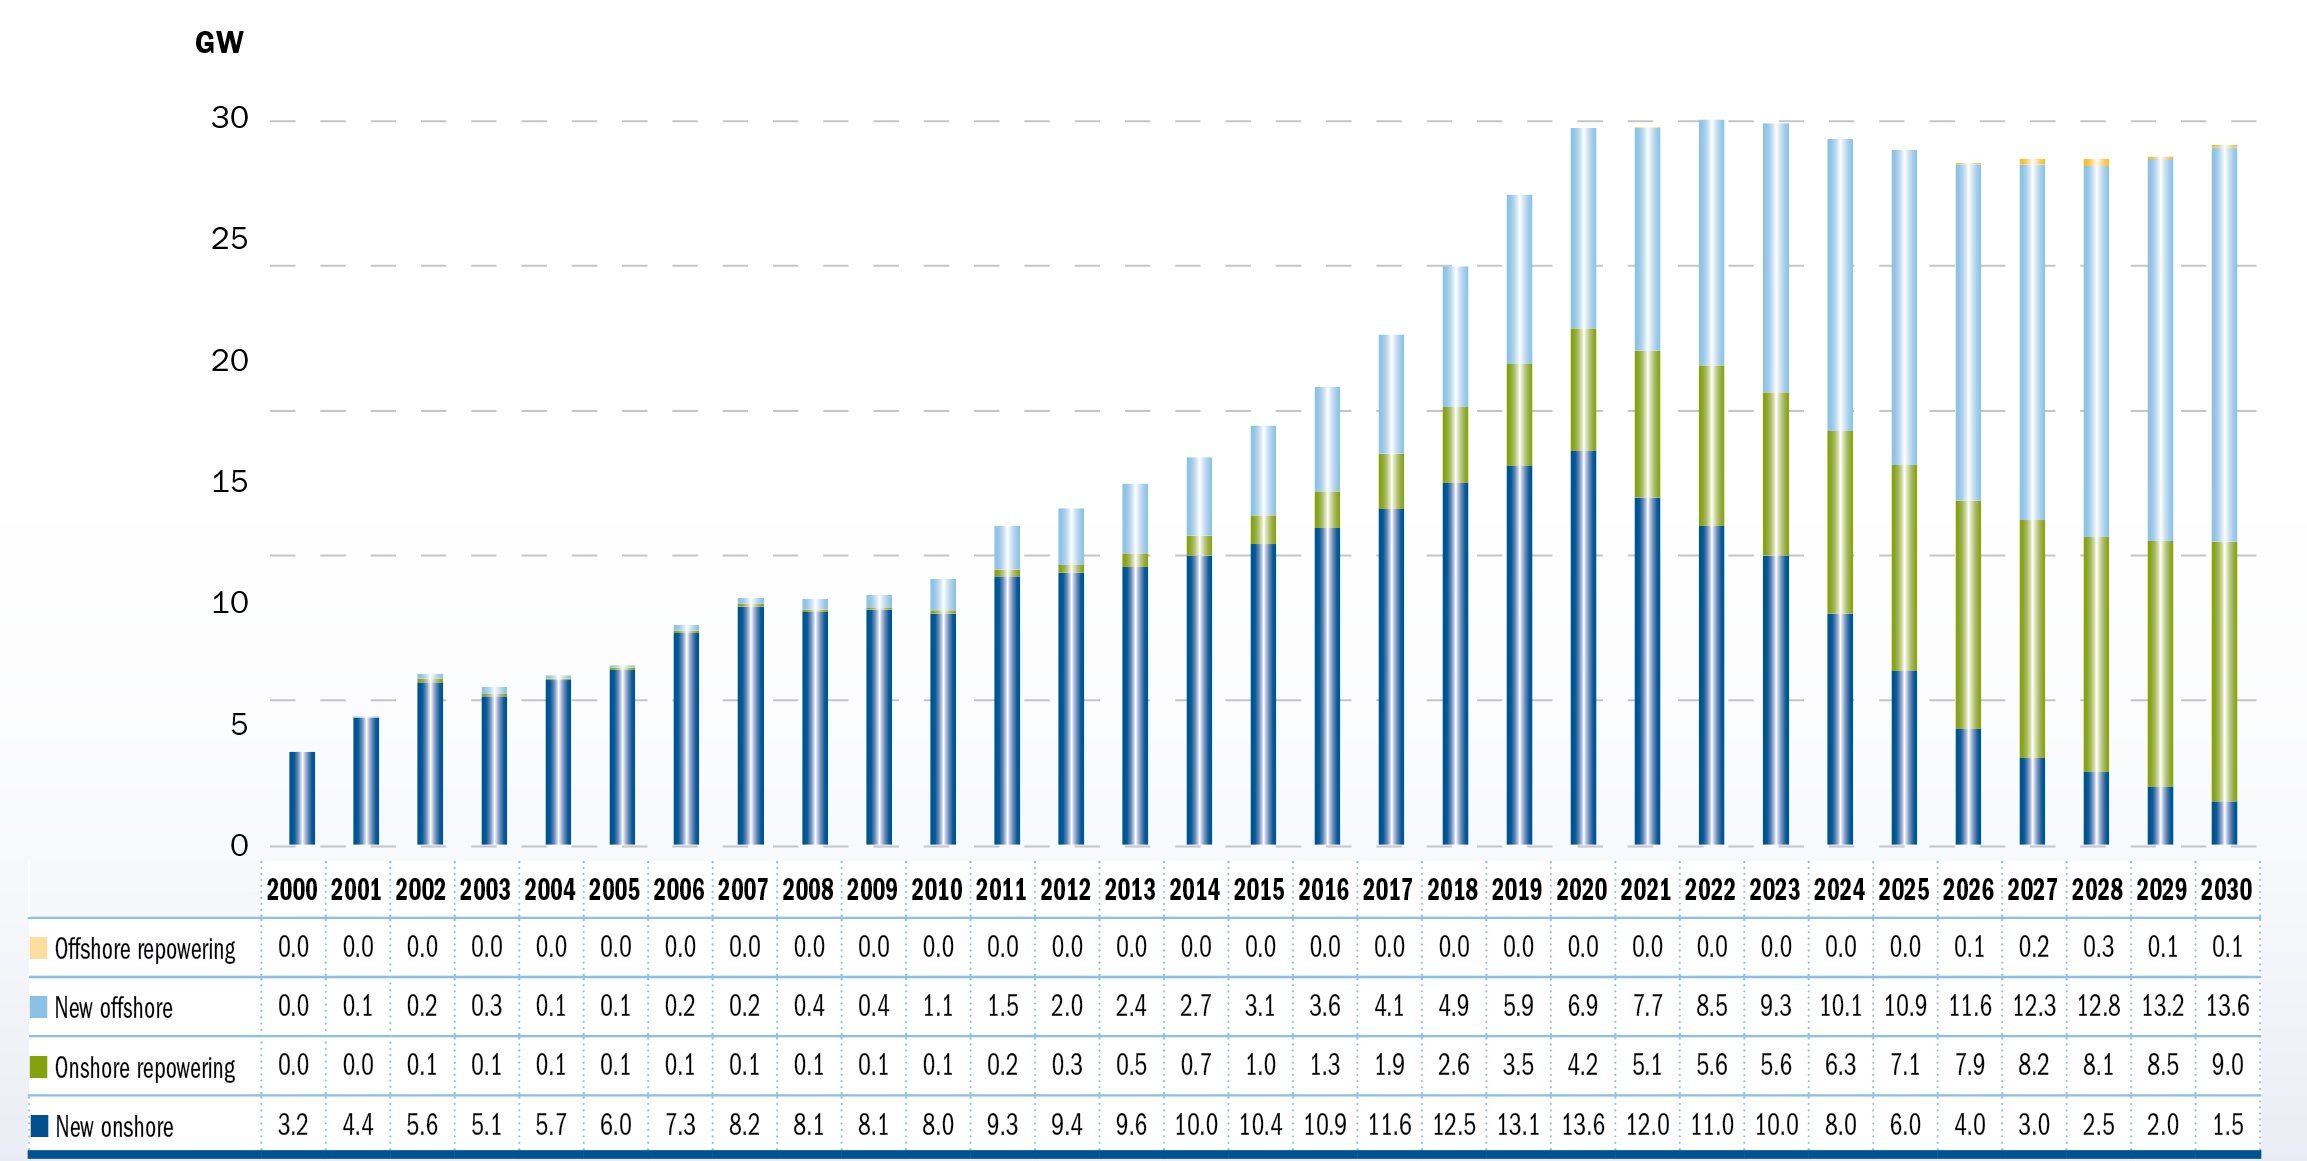
Data collected in February 2010 indicates that 2009 installations were 10.163 Mw in the EU, above the EWEA scenario developed in November 2009.
Source: EWEA (2009): Pure Power, p.47
By 2030, wind energy will produce 1.155 TWh of electricity, half of it from offshore wind power, and cover between 26 per cent and 34.7 per cent of EU electricity demand, depending on future power consumption.
Figure 2.11: Power production from onshore and offshore wind in the EU (2000-2030)
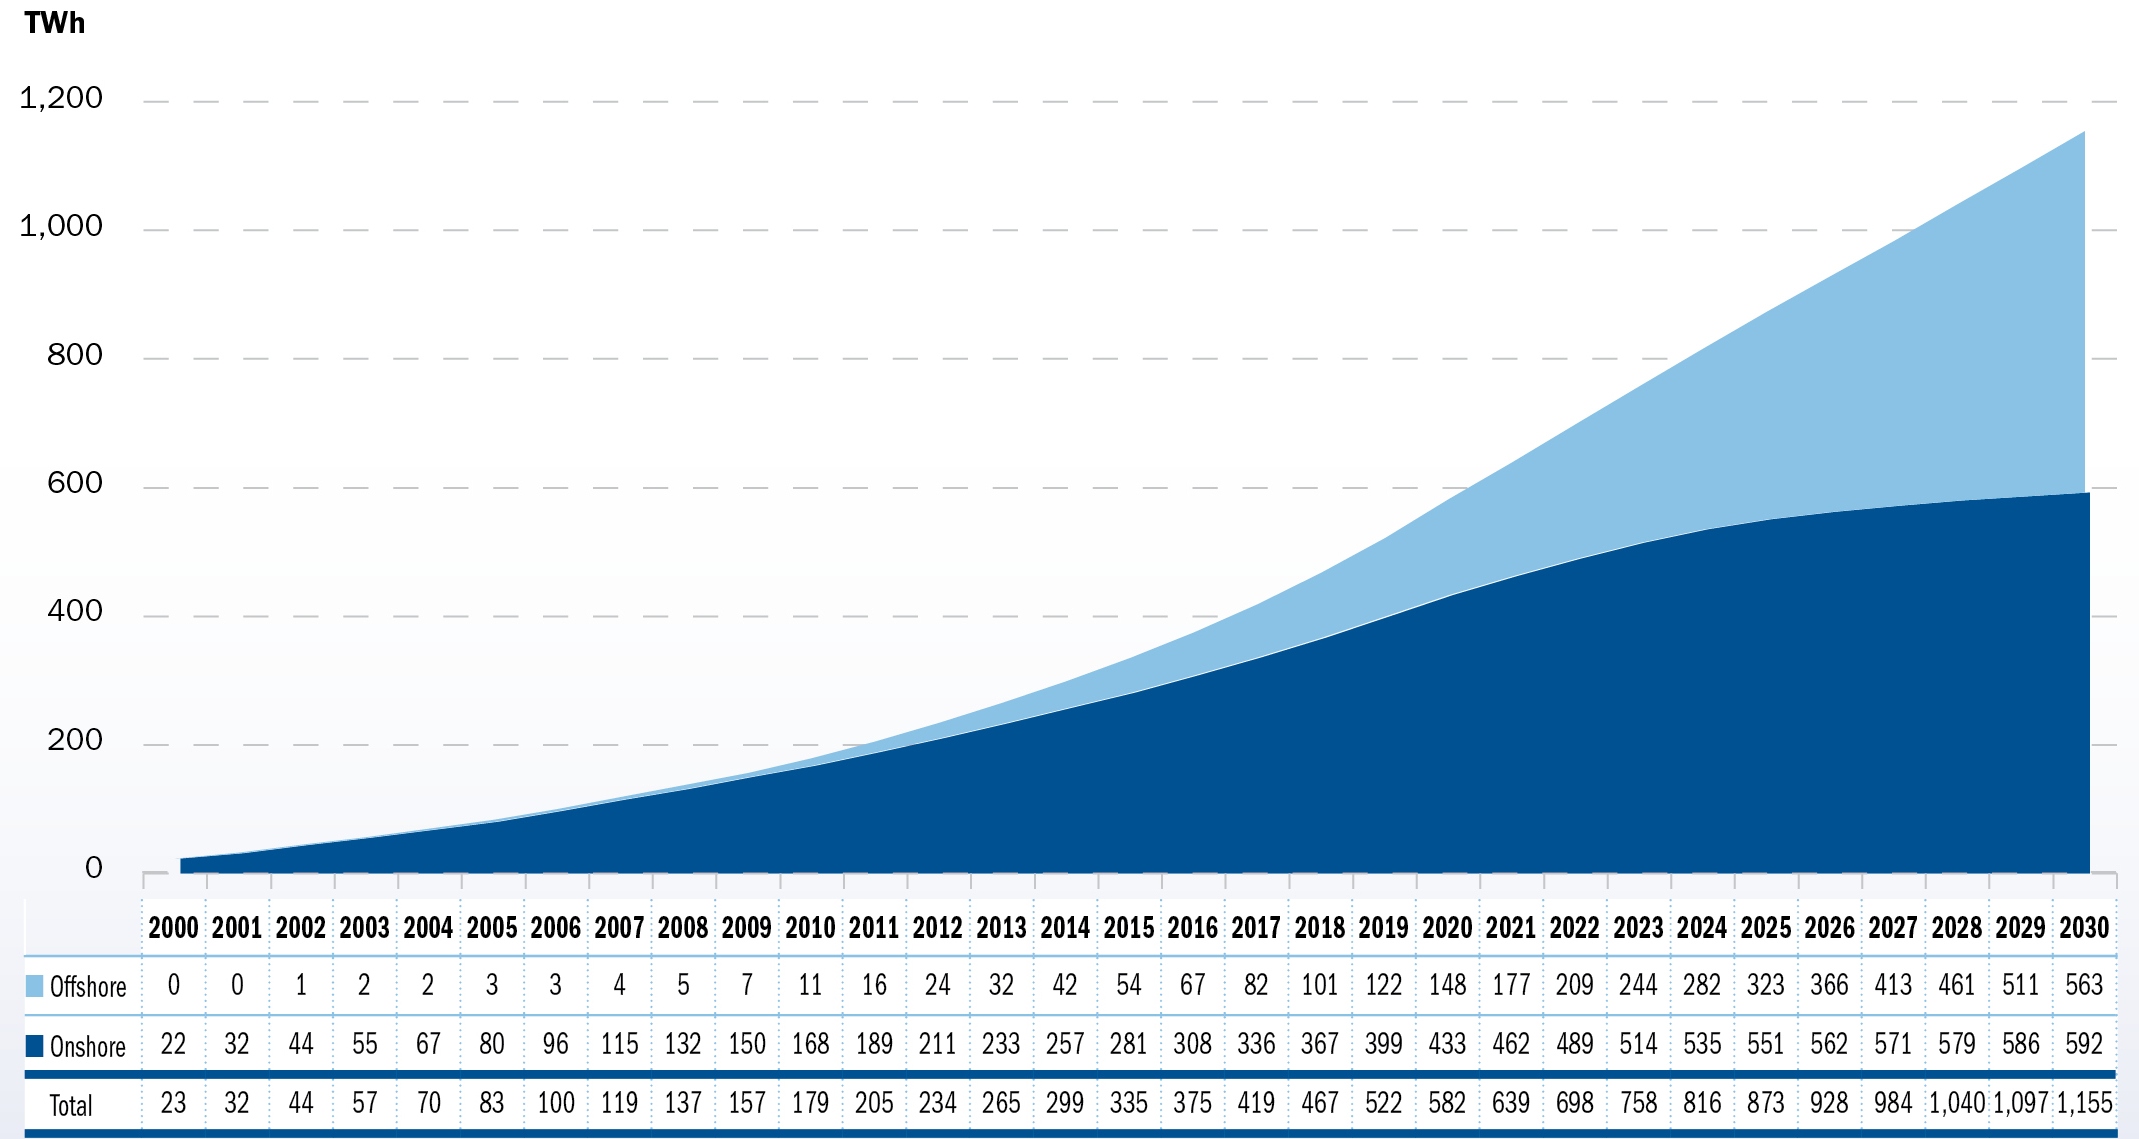
Source: EWEA (2009): Pure Power, p.46
The onshore market will average 12 GW a year during the 2020-2030 decade and 54 per cent of the onshore market will come from the replacement of older wind turbines. The offshore segment almost doubles its annual installations from 7.7 GW in 2021 to 13.7 GW in 2030.
The wind power production in 2030 will avoid the emission of 600 Mt of CO², the equivalent of taking more than 291 million cars off the roads. In 2006 there were 220 million passenger cars in the EU-27.
| Acknowledgements | Sitemap | Partners | Disclaimer | Contact | ||
|
coordinated by |
supported by  |
The sole responsibility for the content of this webpage lies with the authors. It does not necessarily reflect the opinion of the European Communities. The European Commission is not responsible for any use that maybe made of the information contained therein. |
