MAIN PUBLICATION :
| Home � SCENARIOS & TARGETS � Costs and benefits of wind... |

|
CHAPTER 4: COSTS AND BENEFITS OF WIND DEVELOPMENT IN THE EU-27
GENERATION COSTS AND INVESTMENTS
One of the significant advantages of wind power is that the fuel is free. Therefore, the total cost of producing wind energy throughout the 20- to 25-year lifetime of a wind turbine can be predicted with great certainty. Neither the future prices of coal, oil or gas, nor the price of carbon, will affect the cost of wind power production significantly.
In order to calculate the wind power investments needed to reach EWEA’s reference scenario, it is necessary to make assumptions regarding the future cost of installed wind power capacity. For some years, it has been assumed as a rule of thumb that installed wind power capacity costs approximately €1000/kW. That is probably still valid. However, since 2000 there have been quite large variations in the price (not necessarily the cost) of installing wind power capacity; these were described in Part III – The Economics of Wind Power.
In the period 2001 to 2004, the global market for wind power capacity grew less than expected, and created a surplus in wind turbine production capacity. Consequently, the price of wind power capacity went down dramatically – to €700–800/kW for some projects. In the three years to 2007, the global market for wind energy increased by 30–40 per cent annually, and demand for wind turbines surged, leading to increases in prices.
The European Commission, in its Renewable Energy Roadmap, assumes that onshore wind energy cost €948/kW in 2007 (in €2005). It assumes that costs will drop to €826/kW in 2020 and €788/kW in 2030. That long-term cost curve may still apply for a situation where there is a better balance between demand and supply for wind turbines than at the present time. Figure 4.1 shows the European Commission’s assumptions on the development of onshore and offshore wind power capacity costs up to 2030. In addition, there are two curves that reflect the effect of the current demand/supply situation on wind turbine prices in recent years. EWEA assumes onshore wind energy prices of €1300/kW in 2007 (€2005 prices) and offshore prices of €2300/kW. The steep increase in offshore prices reflects the limited number of manufacturers in that market, the current absence of economies of scale due to low market deployment and bottlenecks in the supply chain.
Fig 4.1: Cost/Price of Onshore and Offshore Wind (€/KW)
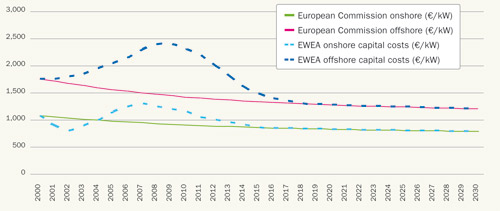
Source: EWEA (2008a)
Based on the EWEA reference scenario for installed capacity up to 2030 and the wind power capacity prices above, Figure 4.2 shows the expected annual wind power investments from 2000 to 2030. The market is expected to stabilise at around €10 billion per year up to 2015, with a gradually increasing share of investments going to offshore. By 2020, the annual market for wind power capacity will have grown to €17 billion annually, with approximately half of investments going to offshore. By 2030, annual wind energy investments in the EU-27 will reach almost €20 billion, with 60 per cent of investments offshore.
Fig 4.2: Wind Energy Investments, 2000-2030 (€m)
Source: EWEA (2008a)
Cumulative investments in wind energy over the three decades from 2000 to 2030 will total €390 billion. According to EWEA’s reference scenario, approximately €340 billion will be invested in wind energy in the EU-27 between 2008 and 2030. This can be broken down into €31 billion in 2008–2010, €120 billion in 2011–2020 and €188 billion in 2021–2030. The IEA (2006) expects that €925 billion of investment in electricity generating capacity will be needed for the period 2005 to 2030 in the EU. According to the EWEA reference scenario, €367 billion – or 40 per cent – of that would be investment in wind power.
AVOIDED FUEL COSTS
Fuel is not required to produce wind power. When wind energy is produced, it saves significant amounts of fuel costs in the form of coal, gas and oil that would otherwise have been needed for power production. In addition to these avoided costs, the production of wind energy reduces demand for imported fuel (and thereby the cost of fuel), while reducing the rate of depletion of Europe’s remaining fossil fuel reserves. Naturally, the avoided fuel costs of wind energy depend on the assumptions made about future fuel prices. Oil and gas prices are very closely linked, and coal also follows, to a lesser extent, the price of oil. Both the IEA and the European Commission have for many years made predictions on future coal, gas and oil prices, and most governments base their energy policies on the IEA’s fuel price scenarios. Historically, the IEA and European Commission scenarios have been similar, and both institutions have been very consistent in underestimating the future fuel prices.
A barrel of oil cost US$100 at the start of 2008, and reached a record $147 in July. The IEA predicts that the oil price will fall to $57 in 2010. In 2004, the IEA predicted that oil would cost $22 a barrel in 2010, $26 in 2020 and $29 in 2030 (in year-2000 dollars). Table 4.1 shows the latest oil price estimates from the European Commission (2007) and the IEA (2007) and an alternative oil price scenario from EWEA. As the table shows, the European Commission believes that the price of oil in 2010 will be approximately 60 per cent lower than today (around $120 in September 2008), while the IEA estimates a drop in the price of oil to circa $57 three years from now. Both institutions believe that the price of oil in 2030 will be approximately $60 a barrel – 50 per cent lower than today. Nobody can predict oil prices, but it should be a minimum requirement that the European Commission and the IEA include fuel price sensitivity analysis in their scenarios for the future development of the energy markets.
Table 4.1: Oil Price Assumptions
| Oil price assumptions (in US$2005)* | 2000 | 2005 | 2007 | 2010 | 2015 | 2020 | 2025 | 2030 |
| European Commission, 2007 | 31.3 | 57.1 | 68.9 | 54.5 | 57.9 | 61.1 | 62.3 | 62.8 |
| International Energy Agency, 2007 | 31.5 | 57.1 | 68.9 | 57.2 | 55.5 | 57.0 | 58.5 | 60.1 |
| EWEA 2008 | 31.3 | 57.1 | 68.9 | 100.0 | 105.0 | 110.0 | 115.0 | 120.0 |
* Adjusted to 2005 prices / actual prices until 2007
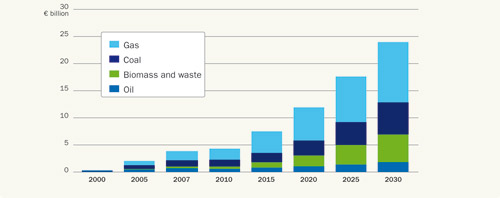
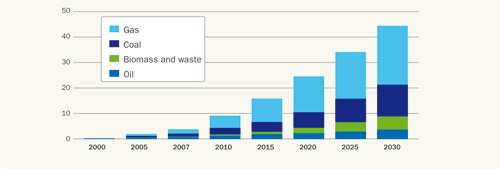
The fuel costs avoided due to wind energy production can be calculated on the basis of the European Commission’s fuel price assumptions for coal, oil and gas up to 2030. As Figure 4.3 shows, wind energy avoided €3.9 billion of fuel costs in 2007: €1.7 billion worth of gas, €1.2 billion worth of coal, €0.7 billion worth of oil and €0.3 billion worth of biomass/waste. In EWEA’s reference scenario, wind energy will avoid fuel costs of €4.4 billion in 2010, €12 billion in 2020 and €24 billion in 2030, based on the European Commission’s fuel price assumptions. Similar results emerge from using the IEA fuel price assumptions.
Fig 4.3: Avoided Fuel Cost from Wind Energy, 2000-2030 (European Commission Fuel Price Assumption)
Source: EWEA (2008a)
Assuming fuel prices equivalent to US$90 per barrel of oil, rather than the European Commission’s assumptions, fuel costs avoided due to wind would be €5 billion in 2007, €8.3 billion in 2010, €20.5 billion in 2020 and €34.6 billion in 2030 (see Figure 4.5).
The calculations here are based on an €/US$ exchange rate of 0.6838 (February 2008). Fluctuations in exchange rates can have a profound effect on the avoided fuel cost. Had the €/$ exchange rate been 1, wind energy’s avoided fuel cost would have been €50.5 billion in 2030 instead of €34.6 billion. However, it could reasonably be argued that the price of oil would be lower if the US dollar were stronger.
Fig 4.4: Avoided Fuel Cost from Wind Energy, 2000-2030 (IEA Fuel Price Assumption)
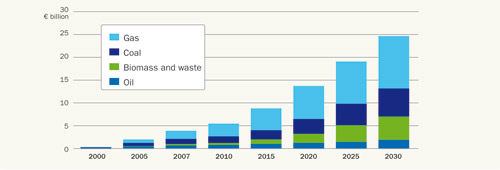
Source: EWEA (2008a)
Fig 4.5: Avoided Fuel Cost from Wind Energy, 2000-2030 (Fuel Price Equivalent to January 2008 -$90/Barrel until 2030)
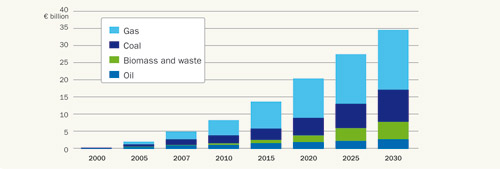
Source: EWEA (2008a)
In EWEA’s fuel price scenario – the oil price increases gradually from $90 to $120 in 2030, and the relationship between oil, gas and coal remains unchanged from the Commission’s scenario – wind energy would avoid fuel costs worth €9.2 billion in 2010, €24.6 billion in 2020 and €44.4 billion in 2030 (see Figure 4.6).
Fig 4.6: Avoided Fuel Cost from Wind Energy, 2000-2030 (Fuel Price Increase to $100 in 2010, $110 in 2020 and $120 in 2030)
Source: EWEA (2008a)
INVESTMENTS AND TOTAL AVOIDED LIFETIME COST
So far, Part VI has looked at wind energy’s contribution to electricity, CO2 reductions, avoided fuel cost and so on from a perspective of total installed capacity by the end of each individual year. In this chapter, a lifetime approach is used in order to determine how much CO2 and fuel cost are avoided from wind power investments made in a given year over the entire lifetime of the capacity. For example, the 300 GW of wind power capacity installed in the EU in 2030 will avoid the emission of 576 Mt of CO2 in the same year. What has not been taken into account so far in this report is that the wind energy capacity installed – for example, the 19.5 GW that will be installed in 2030 – will continue to produce electricity and avoid CO2 and fuel costs beyond 2030 – some CO2 and fuel costs will be avoided right up to 2055. Figure 4.7 (the scenario with oil at $90 and CO2 at €25) shows the total CO2 costs and fuel costs avoided during the lifetime of the wind energy capacity installed for each year from 2008 to 2030, assuming a technical lifetime for onshore wind turbines of 20 years and for offshore wind turbines of 25 years. Furthermore, it is assumed that wind energy avoids 690 g of CO2 per kWh produced, that the average price of a CO2 allowance is €25/t and that €42 million worth of fuel is avoided for each TWh of wind power produced, equivalent to an oil price throughout the period of $90 per barrel.
For example, the 8554 MW of wind power capacity that was installed in the EU in 2007 had an investment value of €11.3 billion and will avoid CO2 emissions worth €6.6 billion throughout its lifetime and fuel costs of €16 billion throughout its lifetime, assuming an average CO2 price of €25/t and average fuel prices (gas, coal and oil) based on $90/barrel of oil.
Similarly, the €152 billion of investments in wind power between 2008 and 2020 will avoid €135 billion worth of CO2 and €328 billion in fuel cost under the same assumptions. For the period up to 2030, wind power investments of €339 billion will avoid €322 billion in CO2 cost and €783 billion worth of fuel.
Fig 4.7: Wind Investments Compared with Lifetime Avoided Fuel and CO2 Costs (Oil at $90/Barrel; CO2 at €25/t)
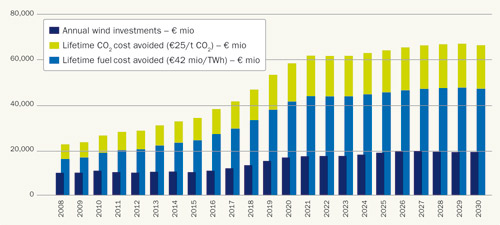
Source: EWEA (2008a)
Fig 4.8: Wind Investments Compared with Lifetime Avoided Fuel and CO2 Costs (Oil at $50/Barrel; CO2 at €10/t)
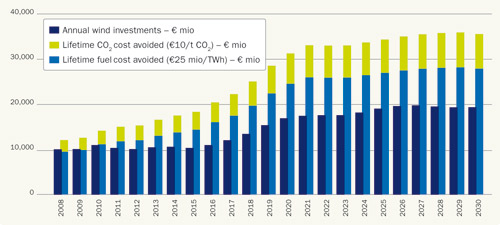
Source: EWEA (2008a)
Fig 4.9: Wind Investments Compared with Life Time Avoided Fuel and CO2 costs (Oil at $120/barrel; CO2 at €50/t)
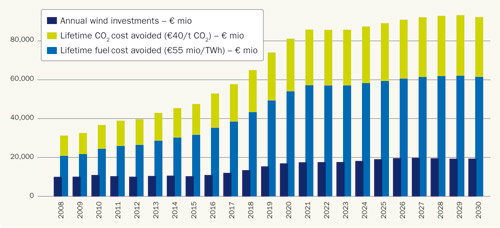
Source: EWEA (2008a)
It is important to note that these calculations only compare the capital cost of wind energy to avoided CO2 and fuel cost. The operation and maintenance cost (low because the fuel is free) has not been taken into account. In addition, it would be reasonable to assume that some components of the wind turbine would need replacing during their technical lifetime. This has not been taken into account either. The purpose is simply to compare the investment value in an individual year with the avoided fuel and CO2 cost over the lifetime of the wind turbines.
As can be seen from Table 4.2, changing the CO2 and fuel price assumptions has a dramatic impact on the result. With low CO2 prices (€10/tonne) and fuel prices (equivalent to $50/barrel of oil) throughout the period, wind power investments over the next 23 years avoid €466 billion instead of €783 billion. With high prices for CO2 (€40/tonne) and fuel (equivalent to $120/barrel of oil), wind power would avoid fuel and CO2 costs equal to more than €1 trillion over the three decades from 2000 to 2030.
Table 4.2: The Different Savings Made Depending on the Price of Oil (per Barrel) and CO2 (per Tonne).
| Totals (oil US$90: CO2 €25) | 2008-2010 | 2011-2020 | 2021-2030 | 2008-2020 | 2008-2030 |
| Investment | 31,062 | 120,529 | 187,308 | 151,591 | 338,899 |
| Avoided CO2 cost | 21,014 | 113,890 | 186,882 | 134,904 | 321,786 |
| Avoided fuel cost |
51,165 | 277,296 | 455,017 | 328,462 | 783,479 |
| Totals (oil US$90: CO2 €25) | 2008-2010 | 2011-2020 | 2021-2030 | 2008-2020 | 2008-2030 |
| Investment | 31,062 | 120,529 | 187,308 | 151,591 | 338,899 |
| Avoided CO2 cost | 8,406 | 45,556 |
74,753 |
53,962 |
128,714 |
| Avoided fuel cost | 30,456 | 165,057 |
270,843 |
195,513 |
466,356 |
| Totals (oil US$90: CO2 €25) | 2008-2010 | 2011-2020 | 2021-2030 | 2008-2020 | 2008-2030 |
| Investment | 31,062 | 120,529 | 187,308 | 151,591 | 338,899 |
| Avoided CO2 cost | 33,623 | 182,223 |
299,011 |
215,846 |
514,857 |
| Avoided fuel cost | 67,002 | 363,126 | 595,856 | 430,128 | 1,025,984 |
| Acknowledgements | Sitemap | Partners | Disclaimer | Contact | ||
|
coordinated by |
supported by  |
The sole responsibility for the content of this webpage lies with the authors. It does not necessarily reflect the opinion of the European Communities. The European Commission is not responsible for any use that maybe made of the information contained therein. |
