MAIN PUBLICATION :
| Home � ENVIRONMENT � Environmental Benefits.. � Emissions and cost in EU 27 in 2007 |

|
Electricity Generation, Emissions and External Cost in the EU-27 Countries in 2007
AMOUNT OF FOSSIL FUEL-BASED ELECTRICITY GENERATION AVOIDABLE/REPLACEABLE BY WIND (AND OTHER RENEWABLE ELECTRICITY GENERATION TECHNOLOGIES) IN 2007
In general, the benefits of wind energy are the avoided emissions and external costs from fossil fuel-based electricity generation. The evaluation of external costs includes damage from:
- Air pollutant emissions;
- The antropogenic greenhouse effect as resulting from CO2 and other emissions; and
- SO2 and NOx
To analyse the environmental and health benefits of the use of wind energy, we need to know the specific emissions of fossil fuel-based electricity generation replaced thereby. These can be derived by dividing the absolute emissions produced by a type of fossil-fuel in kilotonnes of CO2 per year used for electricity generation in a country, by the amount of electricity generated from this fuel in kWh per year.
In our model, wind energy only replaces intermediate load of conventional fossil fuel-based electricity generation. In general, the emissions avoided by wind energy depend on three factors:
- The specific emissions from each type of fossil fuel-based electricity generation facility;
- The fuel mix in each country; and
- The percentage of each fuel replaced by wind energy.
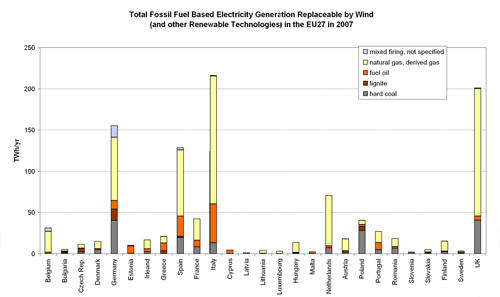
Figure 5.1 presents the absolute levels and shares of fossil fuel-based electricity generation replaceable/avoidable by wind energy (and other renewable electricity generation technologies) in each of the EU-27 Member States according to the individual replaceable shares of fossil fuels in the intermediate load segment comprehensively discussed in the previous chapter (Table 4.2).
Figure 5.1: Fossil Fuel-Based Electricity Generation Replaceable/Avoidable by Wind (and other Renewable Electricity Generation Technologies) in the EU-27 Member States in 2007.
Source: Auer et al. 2007
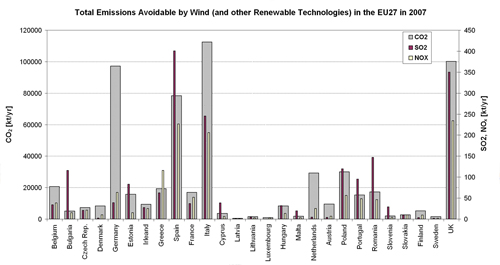
Derived from Figure 5.1, Figure 5.2 presents the total emissions (CO2, SO2, NOx) replaceable/avoidable by wind (and other renewable electricity generation technologies) in the EU-27 Member States in 2007.
Figure 5.2: Total Emissions (CO2, SO2, NOx) Replaceable/Avoidable by Wind (and Other Renewable Electricity Generation Technologies) in the EU-27 Member States in 2007.
Source: Auer et al. 2007
AMOUNT OF FOSSIL FUEL-BASED ELECTRICITY GENERATION REPLACED/AVOIDED BY WIND IN 2007
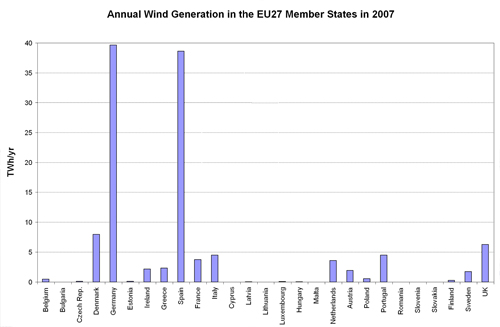
The previous section presents the empirical data on the replaceable/avoidable amount of fossil fuel-based electricity generation. The following section shows the amount of already replaced/avoided fossil fuel-based electricity generation by wind energy in the EU-27 Member States in 2007 . The annual wind generation in each of the EU-27 Member States in 2007 has to be studied first (see Figure 5.3).
Figure 5.3: Annual Wind Generation in the EU-27 Member States in 2007
Source: Auer et al. 2007
Figure 5.3 clearly indicates that already a significant share of EU Member States have implemented a considerable amount of wind energy in 2007. At the top of the list are Germany and Spain (around 39 TWh per year annual wind generation each); Denmark (8 TWh per year) and UK (6.3 TWh per year) are next; and other EU Member States like Portugal, Italy, The Netherlands and France are aiming at the 5 TWh per year benchmark of annual wind generation very fast. However, there still existed many EU-27 Member States with negligible wind penetration in 2007.
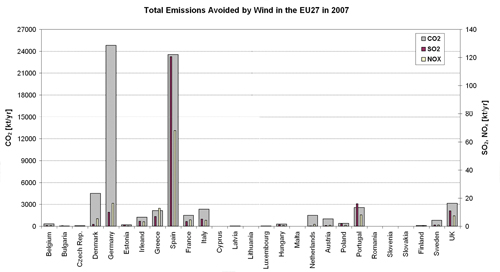
The total CO2, SO2, and NOx emissions from fossil fuel-based electricity generation having been already avoided by wind energy in the different EU-27 Member States in 2007 are presented in Figure 5.4.
The 2007 results in Figure 5.4 take into account the individual characteristics of conventional electricity generation on country level (for example age structure and efficiency of the fossil fuel power plants) in terms of the specific average emissions (CO2, SO2, NOx) from fuel based electricity generation on the one hand (see Figure 4.5), and annual wind generation in 2007 on the other hand (see Figure 5.3). Not surprisingly, the total avoided emissions in 2007 perfectly correlate with annual wind generation in the different EU-27 Member States.
Figure 5.4: Total Emissions (CO2, SO2, NOx) from Fossil Fuel-Based Electricity Generation Already Avoided by Wind Energy in the EU-27 Member States in 2007
Source: Auer et al. 2007
EXTERNAL COSTS OF FOSSIL FUEL-BASED ELECTRICITY GENERATION AND AVOIDED EXTERNAL COST BY WIND IN 2007
So far, empirical results have been presented for each of the EU-27 Member States on fossil fuel-based electricity generation replaceable/avoidable by wind energy (and other renewable generation technologies) in each of the EU-27 Member States in 2007. The factors involved are:
- Average specific emissions (CO2, SO2, NOx) from fossil fuel-based electricity generation in each of the EU-27 Member States in 2007,
- Total wind generation in each of the EU-27 Member States in 2007; and
- Total emissions (CO2, SO2, NOx) already avoided from fossil fuel-based electricity generation in each of the EU-27 Member States in 2007.
These analyses provide the basis for the final step to determine the external costs of fossil fuel-based electricity generation and the already avoided external costs of wind generation in the EU-27 Member States in 2007.
The external costs resulting from air pollutants such as SO2 and NOx (calculated by EcoSense; see Methodology for the Calculation of External Costs of Different Electricity Generation Technologies based on the EcoSense Model) have to be added to the external costs of the anthropogenic greenhouse effect resulting from CO2 emissions (not calculated by EcoSense, but based on estimates of Azar and Sterner, 1996, and Watkiss et al., 2005).
Because air pollutants can damage a large number of different receptors, calculations of external costs will generally include a large number of types of damage, which tend to be restricted to the most important impacts to allow a calculation of external costs with a limited resource input. At present, EcoSense includes the following receptors: humans (health), crops, materials (in buildings and so on), forests and ecosystems, with monetary valuation only included for human health, crops and materials. For each of these a bandwidth (high, medium and low values) is determined. There are two approaches to evaluating effects on human health: value of statistical life (VSL) and years of life lost (YOLL).
- The VSL approach measures a society's willingness to pay to avoid additional deaths.
- The YOLL approach takes human age into account. For each year of life lost approximately one-twentieth of the VSL value is used.
Unfortunately, outputs from the EcoSense model used in this analysis do not provide a calculation based on the VSL approach. As pointed out above, VSL may lead to substantially larger external costs than the YOLL approach which is applied by the EcoSense model. Results of former ExternE studies estimate external costs based on both approaches. These resulted in VSL results of approximately three times more than with YOLL. As the present version of EcoSense does not calculate VSL values, the EcoSense results on human health effects based on the YOLL approach have been scaled. This has been done with a factor of one for low-damage cost estimates calculated for human health, a factor of two for medium cost estimates and a factor of three for high estimates.
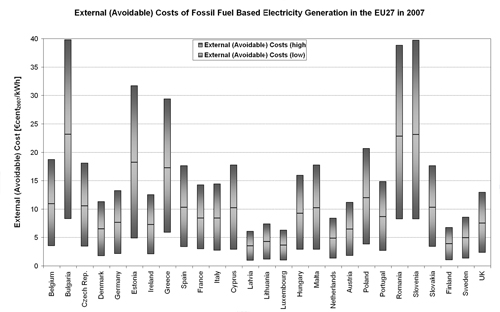
Figure 5.5 finally presents the results on the external costs of conventional fossil fuel-based electricity generation in each of the EU-27 Member States in 2007 (high/average/low values). Similar to the specific emissions of fossil fuel-based electricity generation presented in Figure 4.5, there is a noticeable difference between external costs within different EU-27 Member States. Bulgaria, Romania and Slovenia are the Member States with the highest external costs of fossil fuel-based electricity generation (average values 20-25c€2007/kWh), but also Estonia and Greece reach nearly 20c€2007/kWh (average values for external costs). On the contrary, Latvia, Lithuania, Luxembourg, Finland, Sweden and The Netherlands are characterised by external costs of fossil fuel-based electricity generation below 5c€2007/kWh (average values for external costs).
Figure 5.5. Bandwidth of Specific External Costs of Fossil Fuel-Based Electricity Generation in the EU-27 Member States in 2007.
Source: Auer et al. 2007
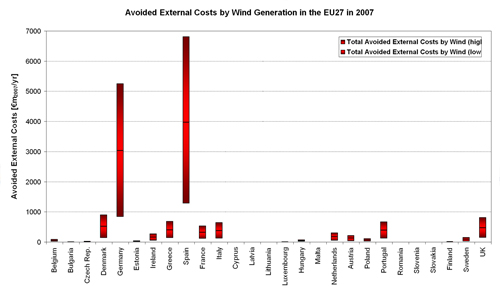
By combining the avoidable external costs of fossil fuel-based electricity generation with the amount of electricity produced by wind energy, the total amount of already-avoided external costs can be calculated for 2007. Figure 5.6 presents the corresponding results of already avoided external costs by wind generation in each of the EU-27 Member States.
Figure 5.6: Bandwidth of Avoided External Costs of Fossil Fuel-Based Electricity Generation in the EU-27 Member States in 2007.
Source: Auer et al. 2007
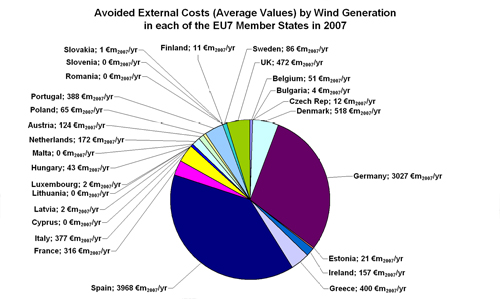
In 2007, in the EU-27 region around €200710.2 billion on external costs have been avoided by wind generation in total (summing up the average values in each of the EU-27 Member States shown in Figures 5.6 and 5.7). The following EU Member States are mainly responsible for the majority shares of this already impressive number:
- Spain (€b20073.968);
- Germany (€b20073.027);
- Denmark (€b20070.518);
- UK (€b20070.472);
- Greece (€b20070.400);
- Portugal (€b20070.388); and
- Italy (€b20070.377).
Figure 5.7 finally presents the absolute values of already avoided external costs by wind generation in each of the EU-27 Member States in 2007.
Figure 5.7. Distribution of Avoided External Costs (Average Values) Through Wind Generation in the EU-27 Member States in 2007
Source: Auer et al. 2007
| Acknowledgements | Sitemap | Partners | Disclaimer | Contact | ||
|
coordinated by  |
supported by  |
The sole responsibility for the content of this webpage lies with the authors. It does not necessarily reflect the opinion of the European Communities. The European Commission is not responsible for any use that maybe made of the information contained therein. |
