MAIN PUBLICATION :
| Home � ENVIRONMENT � Externalities and wind... � Calculation of external costs - EcoSense Model |

|
Methodology for the Calculation of External Costs of Different Electricity Generation Technologies based on the EcoSense Model
THE ECOSENSE COMPUTER MODEL
To calculate the external costs of a given conventional power plant portfolio as well as the avoided external costs of wind energy, it is necessary to model the pathway of emissions from conventional power plants to the different receptors, such as humans, animals, plants, crops and materials, which may be located thousands of kilometres away. As air pollutants can damage a number of different receptors, the task of analysing the impacts of any given emission is fairly complex. To allow such complex analysis of external costs, a tool has been developed during the last ten years in a major coordinated EU research effort, the EcoSense model. The basics of the model are explained below, as used in the calculations of the external costs of electricity generation in the EU-27 Member States in Chapter 5.
EcoSense is a computer model for assessing environmental impacts and the resulting external costs of electricity generation systems. The model is based on the impact pathway approach of the ExternE project (see www.externe.info as well as 'Pioneering Studies' above) and provides the relevant data and models required for an integrated impact assessment related to airborne pollutants (see also European Commission, 1994).
EcoSense provides the wind-rose trajectory model for modelling the atmospheric dispersion of emissions, including the formation of secondary air pollutants. For any given point source of emissions (for example a coal fired power plant), the resulting changes in the concentration and deposition of primary and secondary pollutants can be estimated on a Europe-wide scale with the help of this model. Developed in the UK by the Harwell Laboratory, it covers a range of several thousand kilometres. The reference environment database, which is included in EcoSense, provides receptor-specific data as well as meteorological information based on the Eurogrid-co-ordinate system.
The impact pathway approach can be divided into four analytical steps (see, for example, Mora and Hohmeyer, 2005):
- Calculation of emissions: the first step is to calculate emissions of CO2, SO2 and NOx per kWh from a specific power plant.
- Dispersion modelling: then air-pollutant dispersion around the site of the specific plant is modelled. Based on meteorological data, changes in the concentration levels of the different pollutants can be calculated across Europe.
- Impact analysis: based on data for different receptors in the areas with significant concentration changes, the impacts of the additional emissions on these receptors can be calculated on the basis of so-called dose-response functions. Important data on receptors included in the model database are, for example, population density and land use patterns.
- Monetisation of costs: the last step is to monetise the impacts per kWh caused by the specific power plant. In this stage, the calculated physical damage to a receptor is valued on a monetary scale, based on the best available approaches for each type of damage.
INPUT DATA TO THE MODEL
Because the EcoSense model requires a specified site as a starting point for its pollutant dispersion modelling, one typical electricity generation site has been chosen for each country to assess the impacts and to calculate the costs caused by emissions from fossil-fuel fired power plants which may be replaced by wind energy. The coordinates at each site are chosen in order to locate the reference plants centrally in the electricity generating activities of each country that has been chosen. Thus, it is assumed that the chosen site represents approximately the average location of electricity generating activities of each country that has been chosen.
To control for effects caused by this assumption and to prevent extreme data results, a sensitivity analysis was carried out by shifting the geographical location of the plant. This analysis showed a relatively high sensitivity of external costs to the location of the electricity generation facilities. This is due to the very heterogeneous distribution of the different receptors in different parts of a country.
In order to run the model, the capacity of the conventional power plant, its full load hours of operation and the volume stream of exhaust gas per hour are required. The assumptions made for the calculations are shown in Table 4.1 for the different fossil fuels of conventional electricity generation.
Table 4.1: Assumed Data for the Calculation of the Reference Fossil Fuel-Based Power Plant Technology
| Fuel Type | Capacity (MW) | Full Load Hours per Year | Volume Stream per Hour (m³) |
| Hard Coal | 400 | 5,000 | 1,500,000 |
| Lignite | 800 | 7,000 | 3,000,000 |
| Fuel Oil | 200 | 2,000 | 750,000 |
| Natural Gas Derived Gas |
200 | 2,000 | 750,000 |
| Mixed Firing Not Specified |
400 | 5,000 | 1,500,000 |
For each country, calculations have been performed for a representative conventional power plant location based on the specific national emission data for each fuel and each pollutant.
The evaluation in the EcoSense model includes damage from air-pollutant emissions like SO2 and NOx (PM10 is negligible compared to these) for the major receptors: humans, crops and materials. For each of the pollutants, high, medium and low specific external costs are derived per country.
The costs of the anthropogenic greenhouse effect resulting from CO2 emissions are not modelled here in the EcoSense model, but are based on estimates from Azar/Sterner (1996) and Watkiss et al. (2005). Three different levels of specific external costs are implemented (high, medium and low) for the empirical calculation of CO2-related external costs in the different EU Member States.
Summing up: To calculate the external costs of conventional electricity generation technologies and, subsequently, the avoided external costs by the use of wind energy, the external costs resulting from air pollutants such as SO2 and NOx (calculated by EcoSense) have to be added to the external costs of the anthropogenic greenhouse effect resulting from CO2 emissions (not calculated by EcoSense).
DETERMINATION OF AIR-POLLUTING CONVENTIONAL POWER PLANTS AND REPLACEABLE SEGMENT OF CONVENTIONAL ELECTRICITY GENERATION BY WIND ENERGY
This section identifies, as a first step, the different types of conventional power plants responsible for air pollutions (and, subsequently, for external costs caused by CO2, SO2 and NOx). Then a methodology is derived for the determination of the replaceable segment of conventional electricity generation technologies by wind energy. Finally, empirical data on annual generation and specific emissions is presented for the portfolio of air-polluting conventional power plants in several of the EU-27 Member States.
Determination of Air Polluting Conventional Power Plants
In general, the load duration curve of different types of conventional power plants is split into three different segments: base load, intermediate load and peak load. Typical examples on conventional power plants operating in the different load duration segments are:
- Base load: nuclear power plants, large run-of-river hydro power plants, lignite power plants, hard coal power plants;
- Intermediate load: hard coal power plants, fuel oil fired power plants, combined cycle gas turbine plants; and
- Peak load: pumped-storage hydropower plants, open cycle gas turbine plants
With respect to above-mentioned air-polluting emissions (CO2, SO2 and NOx), several different kinds of fossil-fuel conventional power plants are candidates for further investigation.
Replaceable Segment of Conventional Electricity Generation by Wind Energy
Due to its inherent variability, wind power can at present only replace specific segments of the load duration curve of conventional electricity generation. More precisely, wind energy can replace conventional power plants at the intermediate rather than base-load or peak-load segment.
Keeping this in mind, a reference system can be defined whereby wind energy can be expected to replace conventional power plants:
- First, neither nuclear nor large hydropower plants are replaceable by wind energy, as both almost exclusively operate in the base load segment.
- As pump hydro storage power plants are used to cover very short load peaks, they cannot be replaced by wind energy either, due to the latter's variable nature.
- This leaves conventional electricity generation from the fossil fuels: lignite, hard coal, fuel oil and gas.
However, this assumption can lead to an overestimation of the share of the replaced electricity generation by lignite, as this is predominantly used in the base load segment as well, and to an underestimation of substituted electricity from gas, which, due to the dynamic characteristics of gas fired power plants, lends itself perfectly to balance fluctuations in wind generation. As the current mode of operation of conventional power plants, the rules of their dispatch based on the so-called 'merit order' and the dynamic behaviour of the different types of conventional power plants is well known, it can be safely assumed that a replacement of intermediate load by wind energy is the best description of the complexities of actual operation in the 'real world'.
For detailed empirical analyses, the contributions of the different fossil fuel-based power plant technologies to the intermediate load segment need to be specified. As the best statistics in this context available, data for the power plant in Germany (VDEW, 2000) are used as the basis for such analysis:
- The load curves for one typical load day are derived for each relevant type of fuel and are taken as the basis for the calculation of shares of intermediate load.
- In general, the highest load variations during one day are displayed by fuel oil and gas. Hard coal shows some variation, while electricity generation based on lignite is almost constant.
Although the characteristics of the load curves are based on the German electricity generation structure, conventional power plants have common fuel-specific technical and economic characteristics. Therefore, load curves are assumed to have similar day-to-day variations in several other European countries. Based on these considerations, Table 4.2 sets out assumptions for the intermediate load shares, with the percentage figures being based on the total amount of electricity generated for each fuel.
Table 4.2: Share of Intermediate Load of Different Types of Fossil Fuel-Power Plant
| Fuel Type | Share of Intermediate Load |
| Lignite | 10 |
| hard coal | 30 |
| mixed firing | 50 |
| fuel oil | 100 |
| natural/derives gas | 100 |
Source: Auer et al. (2007)
The assumptions for intermediate load shares being replaceable by wind energy will remain the same for 2020 and 2030 for the fuel types lignite (10 per cent), hard coal (30 per cent), mixed firing (50 per cent) and fuel oil (100 per cent). For natural/derived gas the replaceable share will decrease from 100 per cent (2007) to 92.5 per cent (2020) and 85 per cent (2030) in those EU Member States with no other flexible power plant technologies like pumped hydro storage power plants. Due to significant shares of wind penetration in 2020 and 2030 a certain level of very flexible power plant types like combined cycle gas turbines (CCGTs) is absolutely necessary to balance the electricity systems (see, for example, Auer et al., 2007).
FOSSIL FUEL-BASED ELECTRICITY GENERATION AND ITS SPECIFIC EMISSIONS IN THE EU-27 IN 2007
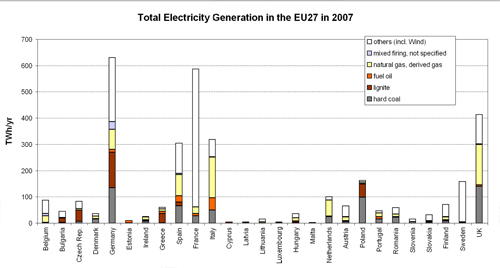
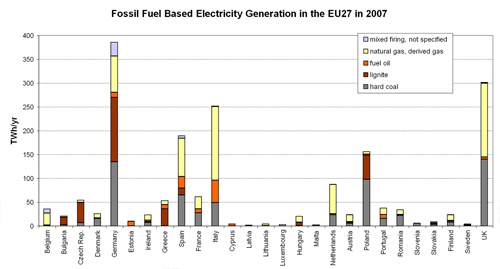
The structure of total electricity generation (by fuel type) and the structure and fractions of fossil fuel-based electricity generation are presented at the EU-27 Member State level in Figure 4.3 and 4.4 respectively. The empirical data is mainly derived from the official 2006 Eurostat Statistics of the European Commission (EU Energy in Figures - Pocket Book 2007/2008) and updated for the reference year 2007 with recent Platts European Power Plant Data Base 2008.
Figure 4.3: Total Electricity Generation (by Fuel Type) in the Different EU 27 Member States in 2007

Source: Auer et al. (2007)
Figure 4.3 indicates that the absolute levels and shares of input fuels for electricity generation vary greatly between the different EU-27 Member States. In particular, Figure 4.3 indicates those fossil fuel-based electricity generation technologies that may well be replaced by wind energy and/or other renewable energy sources in the future. As already mentioned above, neither base-load electricity generation technologies like nuclear and large hydro power nor peak-load technologies like pumped storage hydro power plants are candidates to be replaced by wind energy. Also, several other kinds of renewable electricity generation technologies are incorporated into the category of 'others', since they are not of primary interest in further analyses when discussing fuel substitution by wind energy.
In Figure 4.4, several fossil fuel-based electricity generation technologies at the EU-27 Member State level are presented in detail. The data presented here is the starting point for comprehensive in-depth analyses in subsequent sections.
Figure 4.4: Fossil Fuel-Based Electricity Generation in the different EU 27 Member States in 2007

Source: Auer et al. (2007)
Based on the portfolio of fossil-fuel based electricity generation in the different EU-27 Member States in 2007 presented in Figure 4.4, the corresponding specific air pollutant emissions (CO2, SO2, NOx and PM10 can be determined at a country level. The corresponding absolute air-pollutant emissions of fossil fuel-based electricity generation are derived from a variety of different Member State's statistics as well as from official documents of the European Commission.
In this context it is important to note that the corresponding national studies and statistics take into account a variety of country-specific and technology-specific characteristics, for example the age-structure of the different power plants (and as a consequence also indirectly the primary fuel efficiency) in each of the EU-27 Member States.
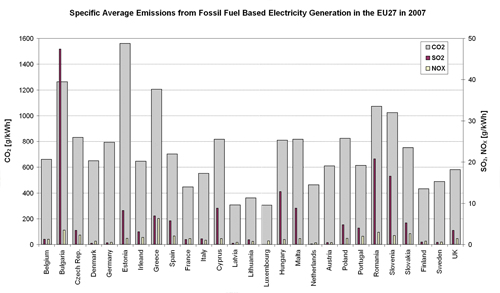
Figure 4.5 finally presents the results on the average specific CO2, SO2 and NOx emissions from fossil fuel-based electricity generation on Member State's level for 2007. In principle, the average specific emissions are less in the 'old' EU-15 Member States (except Greece) than in the 'new' EU-12 Member States. Bulgaria, Estonia, Greece, Romania and Slovenia are among the most air polluting countries within the EU-27, at least in terms of CO2 emissions.
Figure 4.5: Specific Average Emissions (CO2, SO2, NOx) from Fossil Fuel-Based Electricity Generation in the Different EU-27 Member States in 2007.

Figure 4.5 indicates that the difference in specific CO2 emissions from fossil fuel generation is more than a factor of four between various EU-27 Member States. This is related to differences in the fuel mix and because some Member States still have power plants with very low efficiencies. The distribution of SO2 emissions per kWh is also very different, as shown in Figure 4.5. This is related to the very heterogeneous sulphur content of fuel and the use of desulphurisation in only the most advanced Member States. Finally, NOx emissions differ between the countries according to the combustion process used, the combustion temperature, which is not optimal in all the Member States, and the scrubbing technologies employed.
The picture presented in Figure 4.5 will be further elaborated in subsequent sections when discussing the replaceable/avoidable as well as already avoided shares of fossil fuel-based electricity generation by wind energy (and other non-fossil fuel-based generation technologies) for the years 2007, 2020 and 2030.
| Acknowledgements | Sitemap | Partners | Disclaimer | Contact | ||
|
coordinated by  |
supported by  |
The sole responsibility for the content of this webpage lies with the authors. It does not necessarily reflect the opinion of the European Communities. The European Commission is not responsible for any use that maybe made of the information contained therein. |
