MAIN PUBLICATION :
| Home � ECONOMICS � Prices and support mechanisms � Evaluation of the different RES-E support schemes... |

|
Evaluation of the Different RES-E Support Schemes (Effectiveness and Economic Efficiency)
In reviewing and evaluating the different RES-E support schemes described above, the key question is whether each of these policy instruments has been a success. In order to assess the success of the different policy instruments, the most important criteria are:
- Effectiveness: Did the RES-E support programmes lead to a significant increase in deployment of capacities from RES-E in relation to the additional potential? The effectiveness indicator measures the relationship of the new generated electricity within a certain time period to the potential of the technologies.
- Economic efficiency: What was the absolute support level compared to the actual generation costs of RES-E generators, and what was the trend in support over time? How is the net support level of RES-E generation consistent with the corresponding effectiveness indicator?
Other important performance criteria are the credibility for investors and the reduction of costs over time.
However, effectiveness and economic efficiency are the two most important criteria - these are discussed in detail in the following sections.
EFFECTIVENESS OF POLICY INSTRUMENTS
When analysing the effectiveness of RES-E support instruments, the quantities installed are of particular interest. In order to be able to compare the performance between the different countries, the figures are related to the size of the population. Here we look at all new RES-E in total, as well as wind and PV in detail.
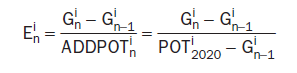
Figure 4.2 depicts the effectiveness of total RES-E policy support for the period 1998 to 2005, measured in yearly additional electricity generation in comparison to the remaining additional available potential for each EU-27 Member State. The calculations refer to following principal:
It is clearly indicated in Figure 4.2 that countries with FITs as a support scheme achieved higher effectiveness compared to countries with a quota/TGC system or other incentives. Denmark achieved the highest effectiveness of all the Member States, but it is important to remember that very few new generation plants have been installed in recent years. Conversely, in Germany and Portugal there has been a significant increase in new installations recently. Among the new Member States, Hungary and Poland have implemented the most efficient strategies in order to promote 'new' renewable energy sources.
Figure 4.2: Policy Effectiveness of Total RES-E Support for 1998-2005 Measured in Annual Additional Electricity Generation in Comparison to the Remaining Additional Available Potential for Each EU-27 Member State
Source: EUROSTAT (2007)

ECONOMIC EFFICIENCY
Next we compare the economic efficiency of the support programmes described above. In this context, three aspects are of interest:
- Absolute support levels;
- Total costs to society; and
- Dynamics of the technology.
Here, as an indicator, the support levels are compared specifically for wind power in the EU-27 Member States.
Figure 4.3 shows that the support level and generation costs are almost equal. Countries with rather high average generation costs frequently show a higher support level, but a clear deviation from this rule can be found in the three quota systems in Belgium, Italy and the UK, for which the support is presently significantly higher than the generation costs. The reasons for the higher support level, expressed by the current green certificate prices, may differ; but the main reasons are risk premiums, immature TGC markets and inadequate validity times of certificates (Italy and Belgium).
For Finland, the level of support for onshore wind is too low to initiate any steady growth in capacity. In the case of Spain and Germany, the support level indicated in Figure 4.3 appears to be above the average level of generation costs. However, the potential with fairly low average generation costs has already been exploited in these countries, due to recent market growth. Therefore, a level of support that is moderately higher than average costs seems to be reasonable. In an assessment over time, the potential technology learning effects should also be taken into account in the support scheme.
Figure 4.3: Onshore Wind: Support Level Ranges (Average to Maximum Support) in EU Countries in 2006 (Average Tariffs are Indicative) Compared to the Long-Term Marginal Generation Costs (Minimum to Average Costs).
Note: Support level is normalised to 15 years
Source: Adapted from Ragwitz et al (2007).
Figure 4.4 illustrates a comparative overview of the ranges of TGC prices and FITs in selected EU-27 countries. With the exception of Sweden, TGC prices are much higher than those for guaranteed FITs, which also explains the high level of support in these countries, as shown in Figure 4.4.
Figure 4.4: Comparison of premium support level: FIT premium support versus value of TGCs. The FIT premium support level consists of FIT minus the national average spot market electricity price.
Source: EEG
 in EU countries in 2006 (average tariffs are indicative) compared to the long-term marginal generation costs (minimum to average costs). Support level is normalised to 15 years. Source: Adapted from Ragwitz et al (2007).")

| Acknowledgements | Sitemap | Partners | Disclaimer | Contact | ||
|
coordinated by |
supported by  |
The sole responsibility for the content of this webpage lies with the authors. It does not necessarily reflect the opinion of the European Communities. The European Commission is not responsible for any use that maybe made of the information contained therein. |
