MAIN PUBLICATION :
| Home ´┐Ż ENVIRONMENT ´┐Ż Environmental Benefits.. ´┐Ż Avoided external costs in EU-27 in 2030 |

|
Avoided External Cost for different Wind Deployment Scenarios in the EU27 Member States in 2030
In this section wind deployment scenarios for the year 2030 are addressed (exactly the same exercise is conducted like in section
Avoided Emissions and External Cost for different Wind Deployment Scenarios in the EU27 Member States in 2020 for the year 2020). For clarity reasons, empirical results are presented for EWEA's 2030 High Wind Scenario only, since this is the most optimistic assumption at present.
Before presenting the avoided external costs due to wind generation in EWEA's 2030 High Wind Scenario, annual wind generation of EWEA's three wind generation scenarios on EU Member States level in 2030 is shown in Figure 5.23.
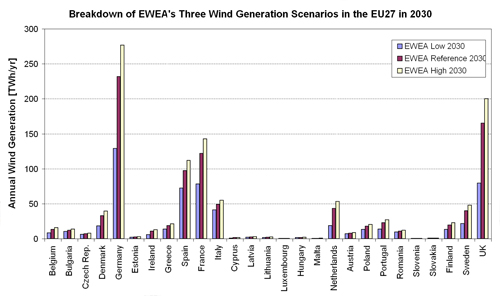
Figure 5.23. Annual Wind Generation (TWh/yr) in each of the EU27 Member States according to EWEA's Three Wind Generation Scenarios in 2030
Figures 5.24-5.25 present €69-billion per year (in total) on avoided external costs in the EU27 Member States by wind generation in EWEA's high wind penetration scenario on an aggregated EU27 level.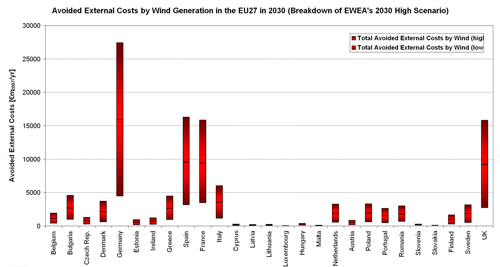
Figure 5.24. Bandwidth of Avoided External Costs (€m2007/yr) of Fossil-fuel Based Electricity Generation according to EWEA's High Scenario in the EU27 Member States in 2030

Figure 5.25. Avoided External Costs by Wind Generation according to EWEA's High Scenario in each of the EU27 Member States in 2030 (In Total: €69-billion per year).
Environmental Benefits of Wind Energy - Concluding Remarks
Empirical analyses in previous sections impressively demonstrate that there exist significant environmental benefits of wind generation compared to conventional electricity generation in the EU27 Member States.
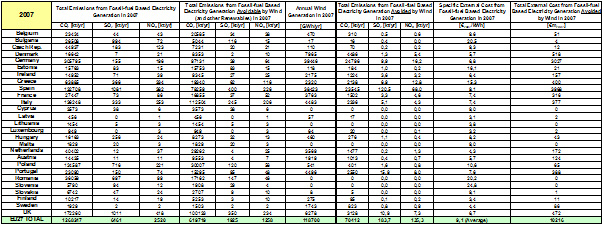
In 2007, total annual wind generation of 118.7 TWh/yr on EU27 Member States level has already avoided 70,412 kt/yr of CO2, 183.7 kt/yr of SO2, 135.3 kt/yr of NOx and, most important, an amount of €m2007 10,216 on external cost of fossil-fuel based electricity generation (see Table 5.1). The countries mainly contributing to these 2007 results in the EU Member States are Germany, Spain, Denmark, and UK.
Table 5.1. Empirical results on avoided emissions and external cost due to wind generation in the EU27 Member States in 2007.
In the next decade until 2020 the share of wind generation will increase considerably in the European power plant mix (compared to the year 2007). Moreover, mainly due to offshore wind deployment (but also a continual increase of onshore wind), the amount of fossil-fuel based electricity generation replaced by wind generation will increase further in several of the three wind deployment scenarios analysed (see Figure 5.2).
Table 5.2. Empirical results on avoided emissions and external cost due to wind generation in the different wind deployment scenarios in the EU27 Member States in 2020.
On aggregated EU27 Member States level, the following amounts on emissions and external cost are avoided due to wind generation in the different wind deployment scenarios:
- Reference Scenario (477.4 TWh/yr): Avoided Emissions: CO2: 217,236 kt/yr, SO2: 379.1 kt/yr, NOx: 313.5 kt/yr; Avoided External Cost: €m2007 32,913;
- High Scenario (554.0 TWh/yr): Avoided Emissions: CO2: 252,550 kt/yr, SO2: 442.0 kt/yr, NOx: 364.8 kt/yr; Avoided External Cost: €m2007 38,284;
- Low Scenario (360.3 TWh/yr): Avoided Emissions: CO2: 165,365 kt/yr, SO2: 299.7 kt/yr, NOx: 240.8 kt/yr; Avoided External Cost: €m2007 25,237;
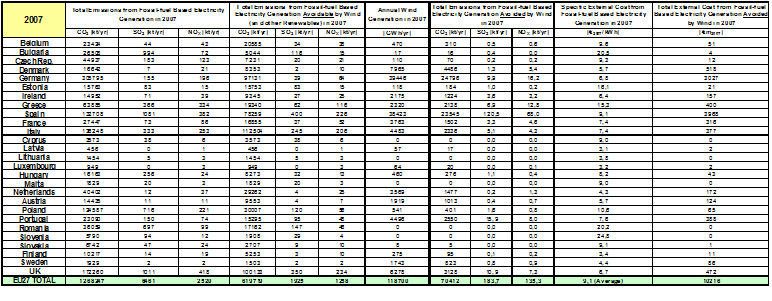
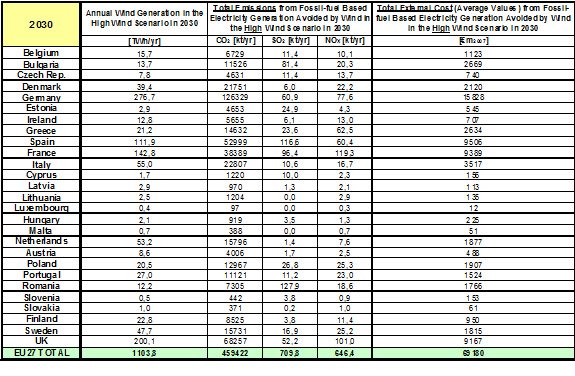
Finally, in the high wind deployment scenario for the year 2030 (1,103.8 TWh/yr; see Table 5.3), the estimates on the environmental benefits of wind generation (compared to fossil-fuel based electricity generation) are in terms of avoided emissions: CO2: 459,422 kt/yr, SO2: 709.8 kt/yr, NOx: 646.4 kt/yr, and in terms of avoided external cost: €m2007 69,180.
Table 5.3. Empirical results on avoided emissions and external cost due to wind generation in the high wind deployment scenario in the EU27 Member States in 2030.
The analyses and results presented above impressively underpin the importance to further significantly increase the share of wind deployment (onshore and offshore) in the EU27 Member States in the next decades. A precondition for the full implementation of the environmental benefits estimated in this study, however, expects both continuous adaption of financial support instruments and the removal of several barriers for market integration of wind energy.
ENDNOTE Chapter 5
Table A.1 briefly summarises the methodology and the specific countries or regions of each of the "early" studies on external costs in the late 1980s and the beginning of the 1990s.
Table A.1. Methodologies of external cost studies. Source: Lee (1996).
| Study | Methodology | Location |
| Hohmeyer and Colleagues (1988) | Top-down apportioning of total environment damages in Germany to the fossil-fuel sector | Germany; existing power plants |
| Ottinger et al (1990) | ||
| Damage base approach in which values were taken from a literature review or previous studies | ||
| US; existing power plants | ||
| Pearce (1992) | Literature survey to identify values used in a damage-based approach to calculate damages. In some respects an update of Ottinger et al (1990) Study from Pace University Center | Estimates for a new and old coal power plant in UK |
| US Department of Energy ORNL/RFF (1994) | Damage function, or impact pathway, approach. Detailed examination and use of scientific literature. Emphasis on developing methodology, rather than on numerical results of specific examples | Estimates for new power plants in rural southwest and southeast US |
| RCG/Tellus (1994) | Damage function approach. Developed EXMOD software | Sterling; rural area in New York state |
| Sitemap | Partners | Disclaimer | Contact | ||
|
coordinated by  |
supported by  |
The sole responsibility for the content of this webpage lies with the authors. It does not necessarily reflect the opinion of the European Communities. The European Commission is not responsible for any use that maybe made of the information contained therein. |
