MAIN PUBLICATION :
| Home » ENVIRONMENT » Environmental Benefits.. » Avoided emissions and external costs in EU-27 in 2020 |

|
Avoided Emissions and External Cost for different Wind Deployment Scenarios in the EU27 Member States in 2020
The previous section presented "real" life in 2007. However, in the following section different scenarios on the portfolio of electricity generation in the EU27 Member States in 2020 are discussed and, subsequently, the same exercises are conducted in term of:
- determination of the share of fossil-fuel based electricity generation and corresponding emissions in each of the EU27 Member States;
- determination of the amount of fossil-fuel based electricity generation and corresponding emissions replaceable/avoidable by wind (and other renewable technologies) in each of the EU27 Member States;
- determination of the replaced/avoided emissions by wind energy in the three EWEA wind generation scenarios and finally
- the external costs of fossil-fuel based electricity generation and, subsequently, avoided external costs by wind generation in the three EWEA wind generation scenarios.
Before presenting the empirical results in subsequent sections, there are at least the following three important notes worth mentioning:
- The (business-as-usual) scenarios on the portfolio of conventional electricity generation are based on the well-known official documents of the European Commission (Capros et al (2008) and also Eurelectric (2006).
- In general, the efficiency of new plants within each of the types of fossil-fuel based electricity generation technologies improves with time and, therefore, the specific emissions in year 2020 decrease compared to 2007.
- Due to expected electricity demand increase, the amount of total fossil-fuel based electricity generation in 2020 is supposed to be higher than in 2007 in almost all EU Member States (but specific emissions per power plant technology - see above - will be lower). However, the significant shares of wind generation in the different EWEA scenarios are expected to be even greater (see the subsequent sections in detail).
Fossil-fuel Based Electricity Generation and Emissions in 2020
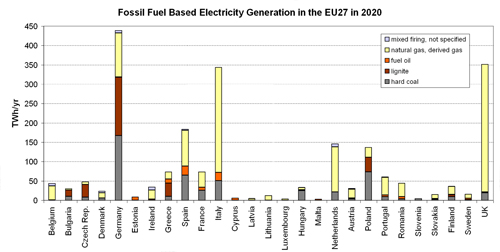
Figure 5.8. Fossil-fuel Based Electricity Generation in the EU27 Member States in 2020.
Figure 5.8 presents fossil-fuel based electricity generation in the EU27 Member States in 2020 and Figure 5.9 the corresponding specific average emissions (CO2, SO2, NOx).
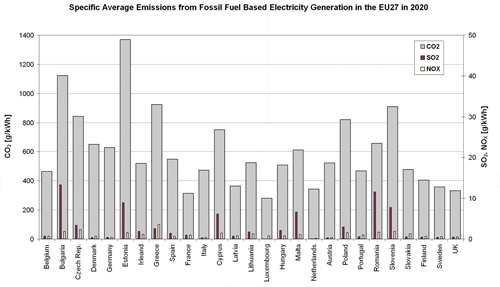
Figure 5.9. Specific Average Emissions (CO2, SO2, NOx) from Fuel Based Electricity Generation in the EU27 Member States in 2020.
Figure 5.10 presents the fossil-fuel based electricity generation replaceable/avoidable by wind (and other renewable electricity generation) in the EU27 Member States in 2020 and Figure 5.11 the corresponding amount of total avoidable emissions (CO2, SO2, NOx).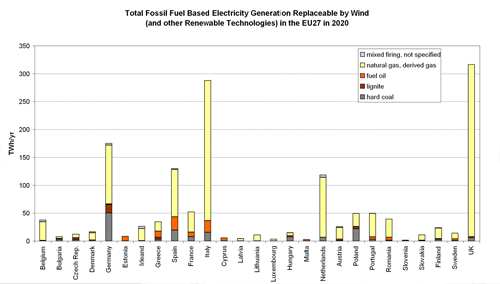
Figure 5.10. Fossil-fuel Based Electricity Generation Replaceable/Avoidable by Wind (and other renewable electricity generation technologies) in the EU27 Member States in 2020.
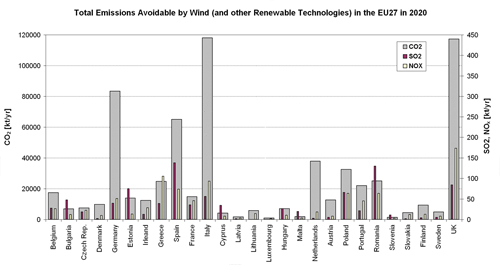
Figure 5.11. Total Emissions (CO2, SO2, NOx) Replaceable/Avoidable by Wind (and other renewable electricity generation technologies) in the EU27 Member States in 2020.
Breakdown of EWEA's Wind Generation Scenarios for 2020 (by EU Member State)
In order to be able to calculate the amount of replaced/avoided fossil-fuel based electricity generation by wind energy in the EU27 Member States in 2020, wind penetration scenarios for the year 2020 are necessary. Figure 5.12 presents EWEA's three wind generation scenarios for the EU27 on a disaggregated - i.e. EU Member States - level. The breakdown of EWEA's three wind generation scenarios on EU Member State level is mainly based on comprehensive modelling and sensitivity analyses with the simulation software model GreenNet-Europe. GreenNet-Europe models least cost deployment of renewable electricity generation technologies (wind in particular) on EU Member State's level up to 2020 and 2030 taking into account several different country-specific potentials and cost of renewable (wind) generation, the different renewable promotion instruments and a variety of other country-specific as well as general parameters and settings. The results of the breakdown of EWEA's three wind generation scenarios, furthermore, have also been cross-checked with other existing publications (e.g. Resch et al (2008), Capros et al (2008) and others.
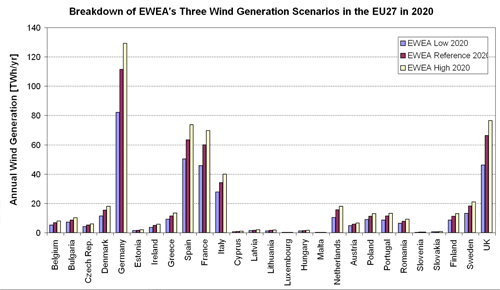
Figure 5.12. Annual Wind Generation (TWh/yr) in each of the EU27 Member States according to EWEA's Three Wind Generation Scenarios in 2020.
Avoided Emissions (of Fossil-fuel Based Electricity Generation) in the Breakdown of EWEA's Wind Generation Scenarios for 2020
In the following Figures 5.13-5.15, the total avoided emissions (CO2, SO2, NOx) by wind generation are presented for EWEA's three wind generation scenarios in each of the EU27 Member States in 2020.
Breakdown of EWEA's 2020 Reference Wind Scenario
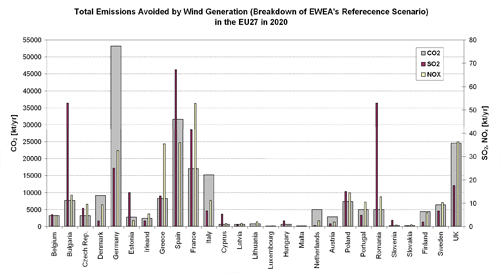
Figure 5.13. Total emissions (CO2, SO2, NOx) from fossil-fuel based electricity generation avoided by wind energy according to EWEA's Reference Scenario in the EU27 Member States in 2020
Breakdown of EWEA's 2020 High Wind Scenario
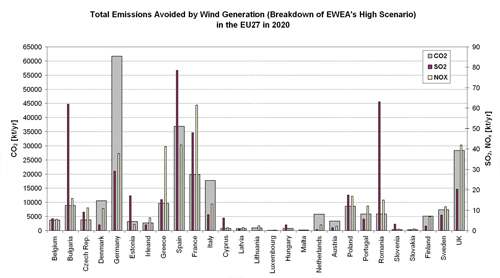
Figure 5.14. Total emissions (CO2, SO2, NOx) from fossil-fuel based electricity generation avoided by wind energy according to EWEA's High Scenario in the EU27 Member States in 2020
Breakdown of EWEA's 2020 Low Wind Scenario
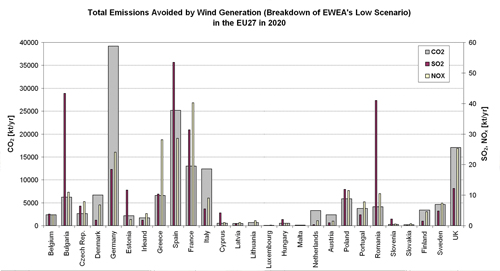
Figure 5.15. Total emissions (CO2, SO2, NOx) from fossil-fuel based electricity generation avoided by wind energy according to EWEA's Low Scenario in the EU27 Member States in 2020
External Costs of Fossil-fuel Based Electricity Generation and Avoided External Costs in the Breakdown of EWEA's Wind Generation Scenarios for 2020
Figure 5.16 presents the results on the calculation of the external costs of conventional fossil-fuel based electricity generation in each of the EU27 Member States in 2020 (high/average/low values), based on the same methodology used for 2007 (see Figure 5.5 in detail). From this, we finally determine the avoided external costs of wind generation in 2020 in Figures 5.17-5.22 (according to EWEA's three wind generation scenarios).
It is important to note that the specific emissions of fossil-fuel based electricity generation technologies in 2020 are less than in 2007, and also the specific external costs in 2020 (Figure 5.16) are, on average, less than in 2007 (see Figure 5.5). In general, the picture for the year 2020 is similar to 2007, i.e. there is still a noticeable difference between the different EU27 Member States. Bulgaria, Slovenia and Estonia are those Member States with the highest external costs of fossil-fuel based electricity generation (average values around 20 €cent2007/kWh). But also Romania and Greece reach nearly 15 €cent2007/kWh (average values for external costs). On the contrary, there are also a significant number of EU Member States with external costs below 5 €cent2007/kWh (average values of external costs).
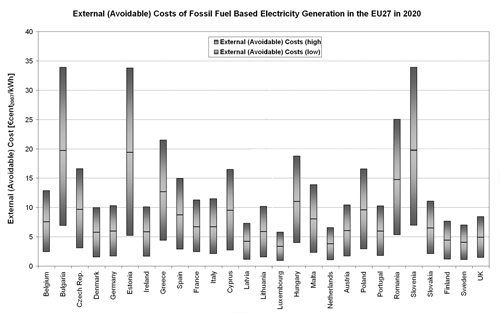
Figure 5.16. Bandwidth of Specific External Costs (€cent/kWh) of Fossil-fuel Based Electricity Generation in the EU27 Member States in 2020.
By combining the avoidable external costs of fossil-fuel based electricity generation (Figure 5.16) with the amount of electricity produced by wind energy (Figure 5.12), the total amount of avoided external costs can be calculated for the year 2020. Subsequent Figures present the results based on EWEA's three wind generation scenarios in each of the EU27 Member States for the year 2020.
Breakdown of EWEA's 2020 Reference Wind Scenario
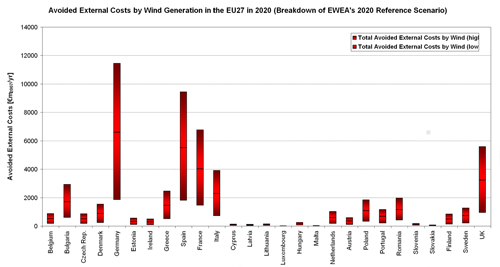
Figure 5.17. Bandwidth of Avoided External Costs (€m2007/yr) of Fossil-fuel Based Electricity Generation according to EWEA's Reference Scenario in the EU27 Member States in 2020
The corresponding total avoided external costs (using the values of the average specific external costs of each of the EU27 Member States in Figure 5.17) are presented in Figure 5.18. On an aggregated EU27 level, the total avoided external costs by wind generation in EWEA's reference scenario in 2020 is around €32-billion per year.
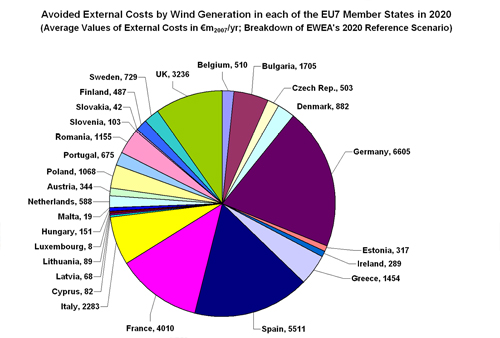
Figure 5.18. Avoided External Costs by Wind Generation according to EWEA's Reference Scenario in each of the EU27 Member States in 2020 (In Total: €32-billion per year).
Breakdown of EWEA's 2020 High Wind Scenario
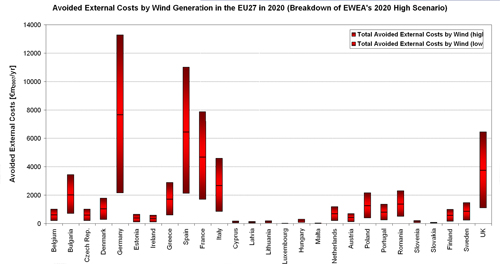
Figure 5.19. Bandwidth of Avoided External Costs (€m2007/yr) of Fossil-fuel Based Electricity Generation according to EWEA's High Scenario in the EU27 Member States in 2020
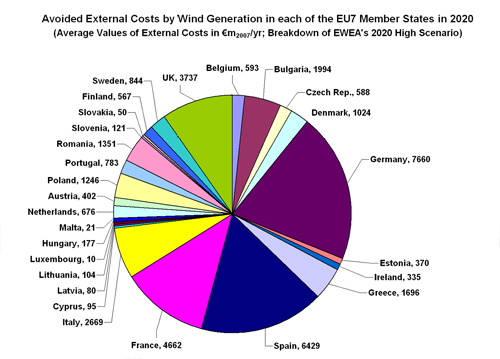
Figure 5.20. Avoided External Costs by Wind Generation according to EWEA's High Scenario in each of the EU27 Member States in 2020 (In Total: €39-billion per year).
Breakdown of EWEA's 2020 Low Wind Scenario
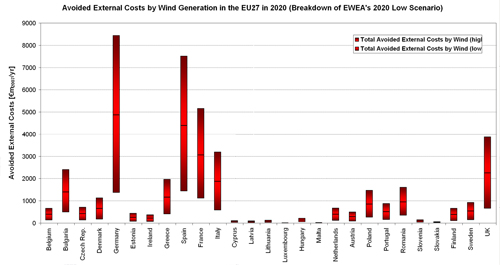
Figure 5.21. Bandwidth of Avoided External Costs (€m2007/yr) of Fossil-fuel Based Electricity Generation according to EWEA's Low Scenario in the EU27 Member States in 2020
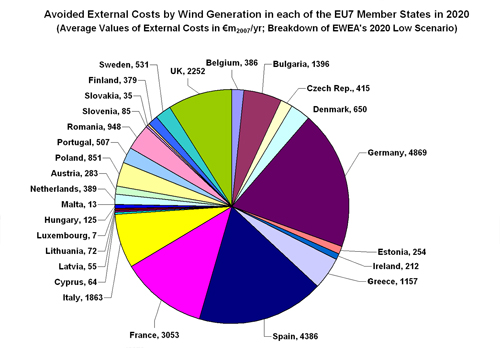
Figure 5.22. Avoided External Costs by Wind Generation according to EWEA's Low Scenario in each of the EU27 Member States in 2020 (In Total: €25-billion per year).
| Sitemap | Partners | Disclaimer | Contact | ||
|
coordinated by  |
supported by  |
The sole responsibility for the content of this webpage lies with the authors. It does not necessarily reflect the opinion of the European Communities. The European Commission is not responsible for any use that maybe made of the information contained therein. |
